The survey is a common method to gather data for various objectives.
Businesses and individuals conduct surveys to get the answers to important questions to understand what their customers and prospects want.
But the problem is…
Are you conduct the survey the right way?
Do you know when to send out surveys?
Do you know how to craft a perfect survey?
What is the ideal number of survey questions?
What are the factors that affect the survey response rate?
To find out the answers, we had surveyed over 12,000 consumers worldwide through email, website, phone, physical form, and face-to-face to know their thoughts about the survey they received.
In this survey research article, we will share with you the 15 survey statistics and facts to help you to conduct the survey perfectly.
The 15 Survey Statistics and Facts [Research Findings]
- The survey response rate through online mediums is 7.8%.
- The follow-up to the survey recipients increased the survey response rate by 25.81%.
- 71.6% of respondents prefer to answer a survey via online medium.
- Over half of the respondents prefer a survey length of 2 minutes.
- 51.3% of respondents prefer the range of 11 to 20 questions for a survey.
- More than half of the people prefer a survey with both objective and subjective questions.
- 60.3% of respondents prefer to answer a survey at night.
- 74% of respondents said the relationship with the company is the key factor to their survey responses, and 68.2% of them will answer a survey to get a gift.
- 83.8% of respondents prefer a cash voucher or gift card as the return of their survey inputs.
- 41% of respondents are more likely to take a survey if the expected completion time is informed upfront.
- 81.2% of respondents will abandon a survey if it is not completed after 5 minutes.
- 93.4% of respondents will not give out their personal details in the survey.
- 72.3% of survey respondents believed their inputs will affect the company’s plan and action.
- 94.7% of respondents are interested to know the survey results.
- 71.9% of respondents expect the improvement to be rolled out in 3 months.
15 Survey Statistics and Facts [Insights & Charts]
Now, let’s discuss the survey results to better understand the respondents’ expectations and needs.
2 Analyzed Survey Statistics
Below are the two important survey statistics based on the analysis of the survey we sent.
These two statistics will answer the following questions:
- What is the survey response rate through online mediums?
- Is the follow-up action works? If yes, what is the improvement rate?
1. The survey response rate through online mediums is 7.8%.

Insight:
Whenever you are surveying via the online medium, send it to 13 times your expected number of respondents.
For instance, if you need inputs from 1,000 respondents via email, send the survey to at least 13,000 people (13,000 x 7.8% = 1,014).
Please note that the survey response rate is dependent on other factors like survey nature, the relationship between surveyor and recipients, recipients’ demographic, and follow-ups.
2. Follow-up to the survey recipients increased the survey response rate by 25.81%.

Insight:
Within the first 5 days of the survey sent, we only receive a response rate of 6.2%, and the figure is increased by 1.6% to 7.8% within the next 5 days after follow-up, which is a 25.81% improvement.
Part of the reason is that when we first sent out the survey, some recipients are busy with other stuff and forget afterward, the follow-up will remind them about the survey sent earlier.
To conclude, the follow-up effort works!
13 Survey Questions & Answers: What Respondents Think and Want
Here are the 13 questions we sent to the respondents to find out what they think about surveys and how they react to the surveys they received.
- What is your preferred medium for a survey?
- What is your preferred time length for a survey?
- How many questions would you prefer to answer in a survey?
- What format of survey questions do you prefer?
- What time do you prefer to answer a survey?
- Which of the following factors will affect your decision to answer a survey?
- What kind of benefits (if there is any) you are expecting to get in return for answering a survey?
- Will knowing upfront the estimated time to finish the survey encourage you to take up the survey?
- With no estimated time informed, what is the acceptable survey duration before you abandon the survey?
- Will you give out personal details in the survey?
- Do you think your inputs will affect the company’s decision?
- Would you like to know the final survey results once the survey is finalized?
- How long would you expect the changes or improvements after the survey is completed?
1. 71.6% of respondents prefer to answer a survey via online medium, followed by the physical form at 15.1%, face to face at 9.2%, and phone at 4.1%.

Survey question: What is your preferred medium for a survey?
Survey result:
- Online (eg: email, web form) – 71.6%
- Phone – 4.1%
- Face to face – 9.2%
- Physical form – 15.1%
Insight:
Most people prefer using an online medium to take the survey.
Online medium also gives more privacy to the respondents and allow them to give honest feedback.
While face-to-face and phone surveys are intimidating for some respondents.
On the other side, the older generation still prefers to use the traditional way to answer a survey such as fill up a physical survey form, probably due to the difficulty in using technology.
Key takeaway: Online mediums like email and web form are the preferred ways to send out a survey.
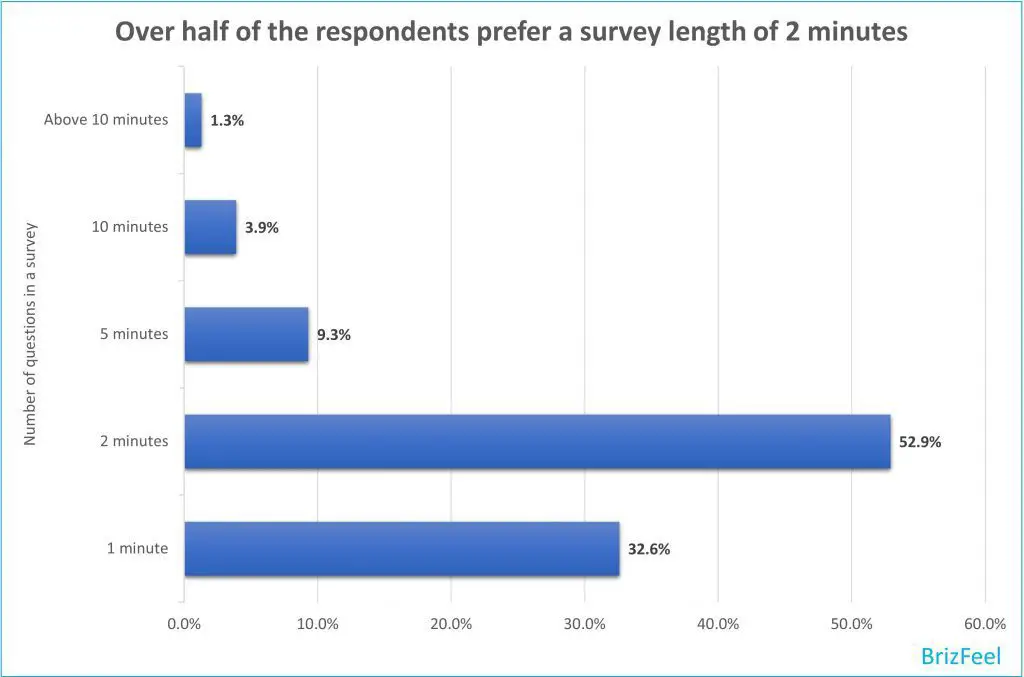
2. 52.9% of respondents prefer a survey length of 2 minutes, followed by 1 minute at 32.6%, 5 minutes at 9.3%, 10 minutes at 3.9%, and above 10 minutes at 1.3%.
Survey question: What is your preferred time length for a survey?
Survey result:
- 1 minute – 32.6%
- 2 minutes – 52.9%
- 5 minutes – 9.3%
- 10 minutes – 3.9%
- Above 10 minutes – 1.3%
Insight:
People prefer a quick survey, and the sweet spot is 2 minutes.
Once you finish the survey questionnaire, try to answer it yourself, and check the time.
For the best result, keep the time required to complete the survey to around 2 minutes.
Key takeaway: The ideal length for surveys is 2 minutes.
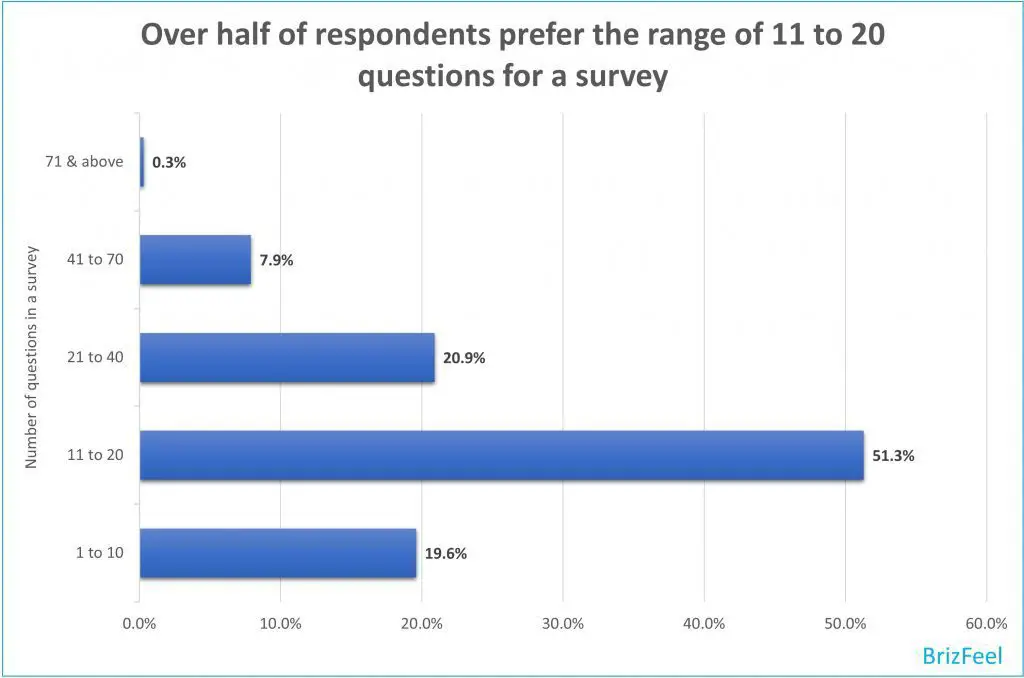
3. 51.3% of respondents prefer the range of 11 to 20 questions for a survey, followed by 21 to 40 questions at 20.9%, 1 to 10 questions at 19.6%, 41 to 70 questions at 7.9%, and above 71 questions at 0.3%.
Survey question: How many questions would you prefer to answer in a survey?
Survey result:
- 1-10 – 19.6%
- 11-20 – 51.3%
- 21-40 – 20.9%
- 41-70 – 7.9%
- 71 & above – 0.3%
Insight:
When crafting the survey questions, keep in mind that the range of 11 to 20 questions is the sweet spot for a survey.
Key takeaway: The ideal number of questions for a survey is 11 to 20.
4. More than half of the people prefer a survey with both objective and subjective questions, followed by 39.2% for objective questions only, and 6.2% for subjective questions only.

Survey question: What format of survey questions do you prefer?
Survey Result:
- Objective questions only – 39.2%
- Subjective questions only – 6.2%
- Both – 54.6%
Insight:
Objective questions make the answering process easier and faster, while subjective questions give the respondents a place to voice out their opinions and unique ideas.
So, the best way is to provide both types of questions in the survey.
Key takeaway: Use both objective and subjective questions in your surveys.
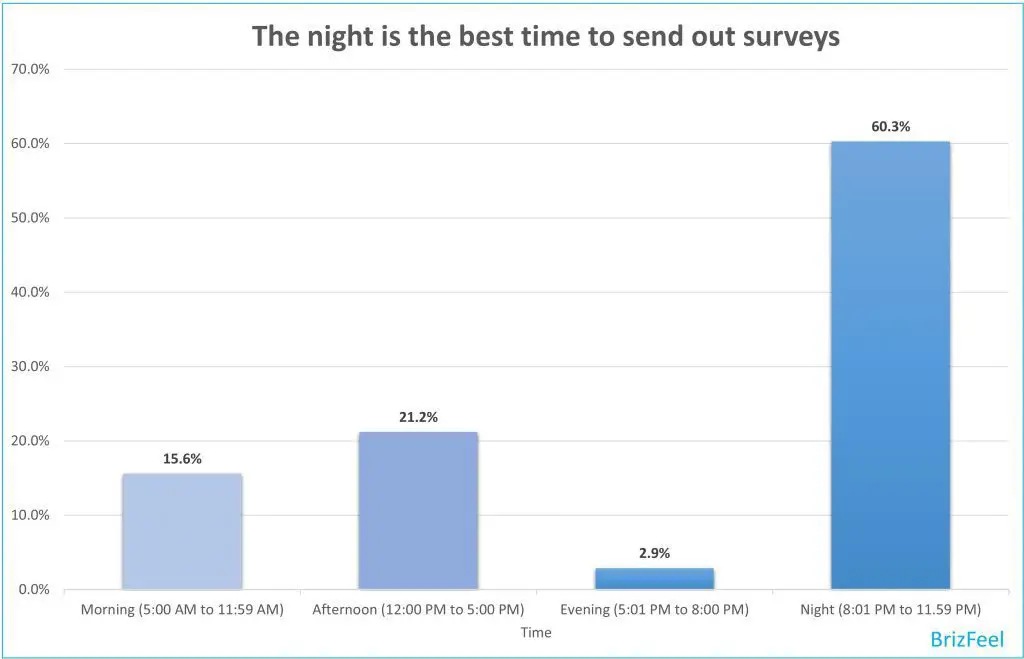
5. 60.3% of respondents prefer to answer a survey at night, followed by the afternoon at 21.2%, morning at 15.6%, and evening at 2.9%.
Survey question: What time do you prefer to answer a survey?
Survey result:
- Morning (5:00 AM to 11:59 AM) – 15.6%
- Afternoon (12:00 PM to 5:00 PM) – 21.2%
- Evening (5:01 PM to 8:00 PM) – 2.9%
- Night (8:01 PM to 11.59 PM) – 60.3%
Insight:
The night is the best time to send out surveys as people are more likely to be free during that time with no work or school.
Most people will not entertain a survey when busy.
Key takeaway: Send out surveys at nighttime.
6. 74% of respondents said the relationship with the company is the key factor to their survey responses, and 68.2% of them will answer a survey to get a gift.
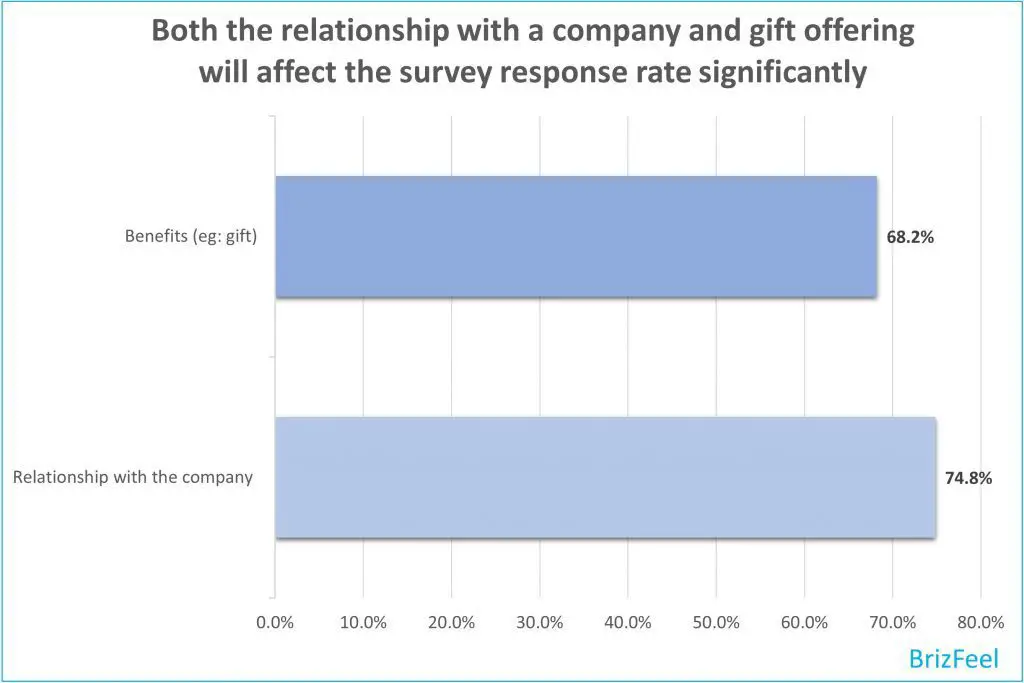
Survey question: Which of the following factors will affect your decision to answer a survey?
Survey result:
- Relationship with the company – 74.8%
- Benefits (eg: gift) – 68.2%
Insight:
The relationship is a key factor in engagement and survey response rate.
Besides, offering a gift in return for their survey responses is a sure-fire way to improve survey response rate, the better the gift, the higher the response rate.
In short, both the relationship with a company and gift offering will affect the survey response rate significantly.
Key takeaway: Build a relationship with your audiences to improve the engagement rate.
7. 83.8% of respondents prefer a cash voucher or gift card as the return of their survey inputs.
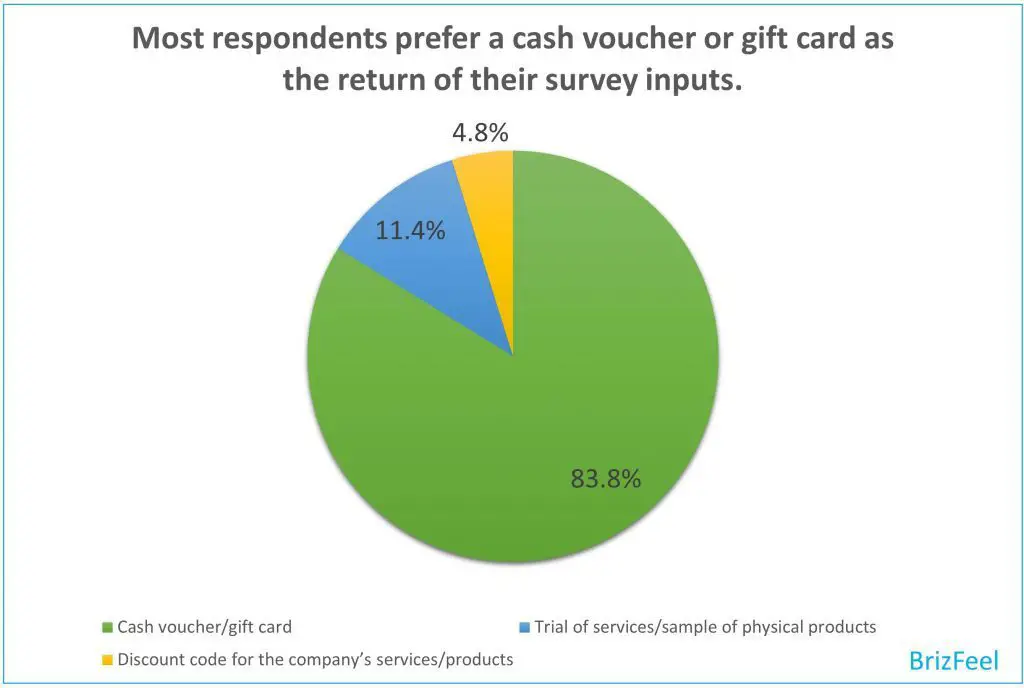
Survey question: What kind of benefits (if there is any) you are expecting to get in return for answering a survey?
Survey result:
- Cash voucher/gift card (eg: Amazon gift card, petrol gift card) – 83.8%
- Trial of services/sample of physical products – 11.4%
- Discount code for the company’s services/products – 4.8%
Insight:
Most respondents prefer a cash voucher/gift card as it brings a direct benefit and applies to most people, while a discount code requires you to spend money and only benefits buyers.
Key takeaway: People prefer cash vouchers or gift cards as the benefit of answering a survey.
8. 41% of respondents are more likely to take a survey if the expected completion time is informed upfront.
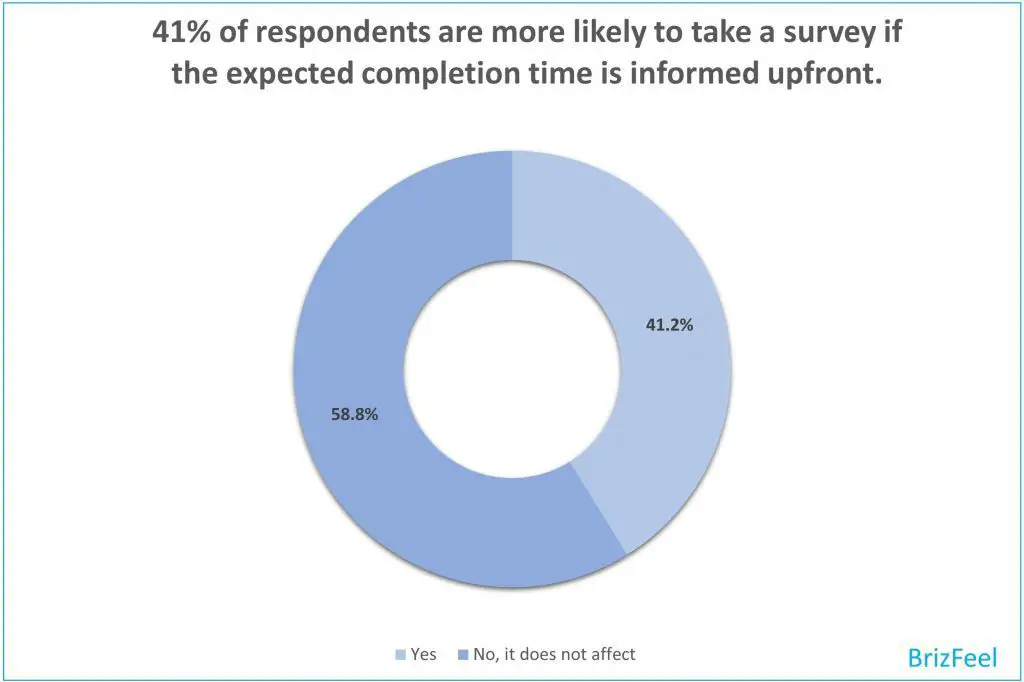
Survey question: Will knowing upfront the estimated completion time encourage you to take up the survey?
Survey result:
- Yes – 41.2%
- No, it does not affect – 58.8%
Insight:
By informing the estimated time to complete the survey, you can expect a higher survey response rate.
Key takeaway: Always inform your survey respondents of the estimated completion time.
9. 81.2% of respondents will abandon a survey if it is not completed after 5 minutes.
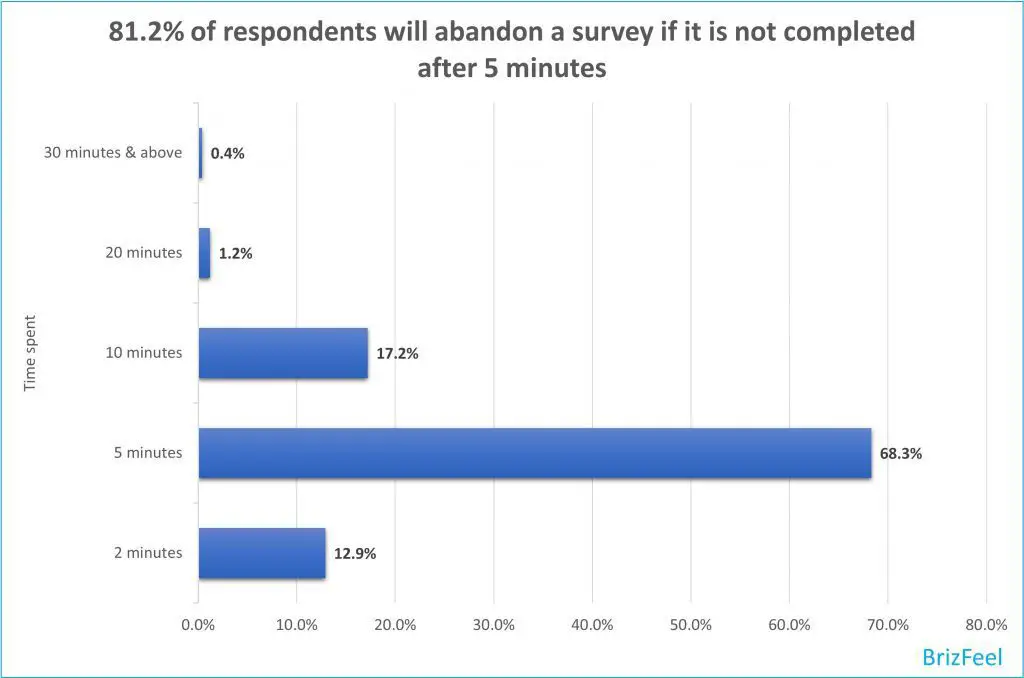
Survey question: With no estimated time informed, what is the acceptable survey duration before you abandon the survey?
Survey result:
- 2 minutes – 12.9%
- 5 minutes – 68.3%
- 10 minutes – 17.2%
- 20 minutes – 1.2%
- 30 minutes & above – 0.4%
Insight:
People are impatient, so make sure the survey can be completed within 2 to 5 minutes. For a longer survey, make sure you inform the respondents upfront.
Otherwise, some respondents will drop the survey halfway before completing it.
Key takeaway: Keep the survey length below 2 minutes or not more than 5 minutes.
10. 93.4% of respondents will not give out their personal details in the survey.
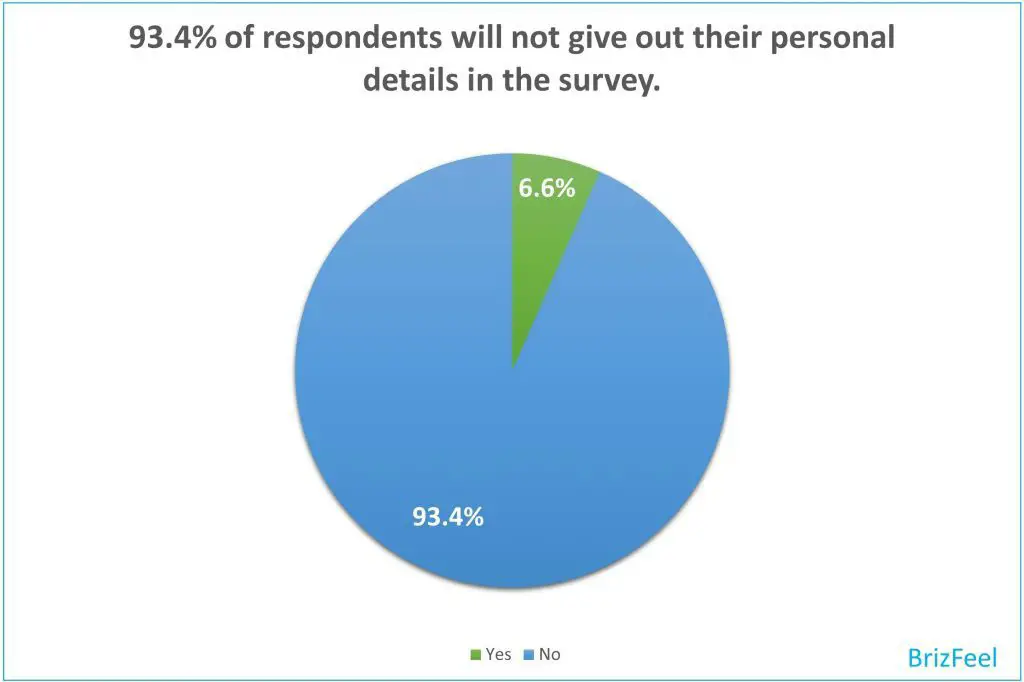
Survey question: Will you give out personal details in the survey?
Survey result:
- Yes – 6.6%
- No – 93.4%
Insight:
People are concern about their privacy, so try not to ask for any personal detail in a survey unless necessary, especially sensitive data.
Key takeaway: Never ask for personal details in a survey.
11. 72.3% of survey respondents believed their inputs will affect the company’s plan and action, while 27.7% of them are unsure about it.
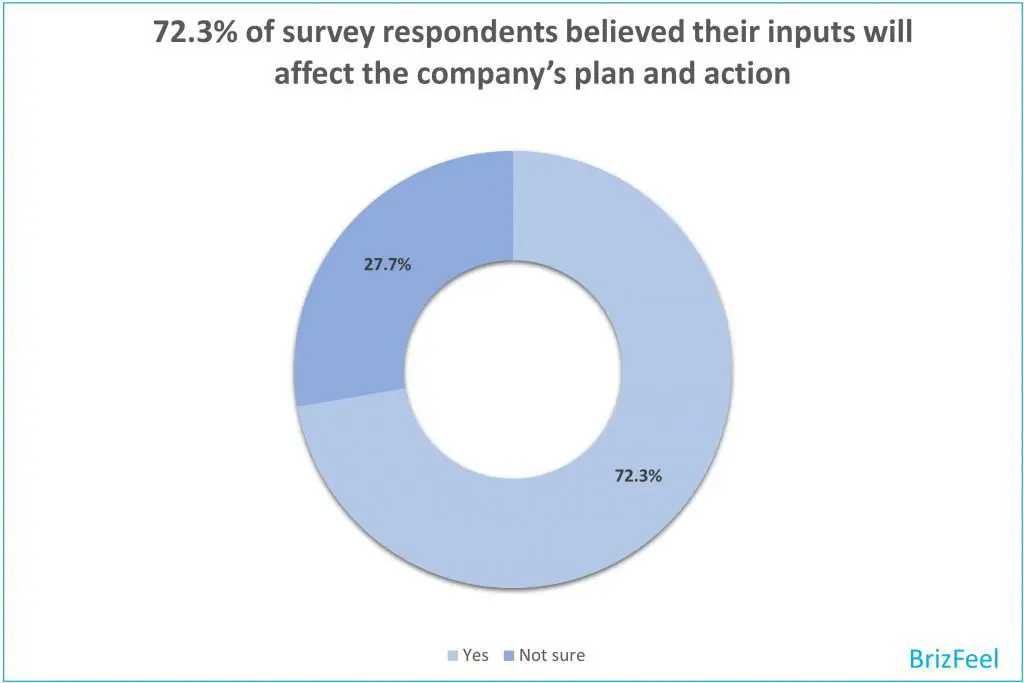
Survey question: Do you think your inputs will affect the company’s decision?
Survey result:
- Yes – 72.3%
- Not sure – 27.7%
Insight:
I believed most respondents who spend their time answering a survey would want their voices to be heard and accepted by the company.
Based on the result, most of them are positive against their contributions.
However, some of them are unsure whether their voices will be taken by the company.
Maybe they think their opinions are the minority?
Key takeaway: Most respondents believe their survey inputs will affect the company’s decision and plan.
12. 94.7% of respondents are interested to know the survey results.
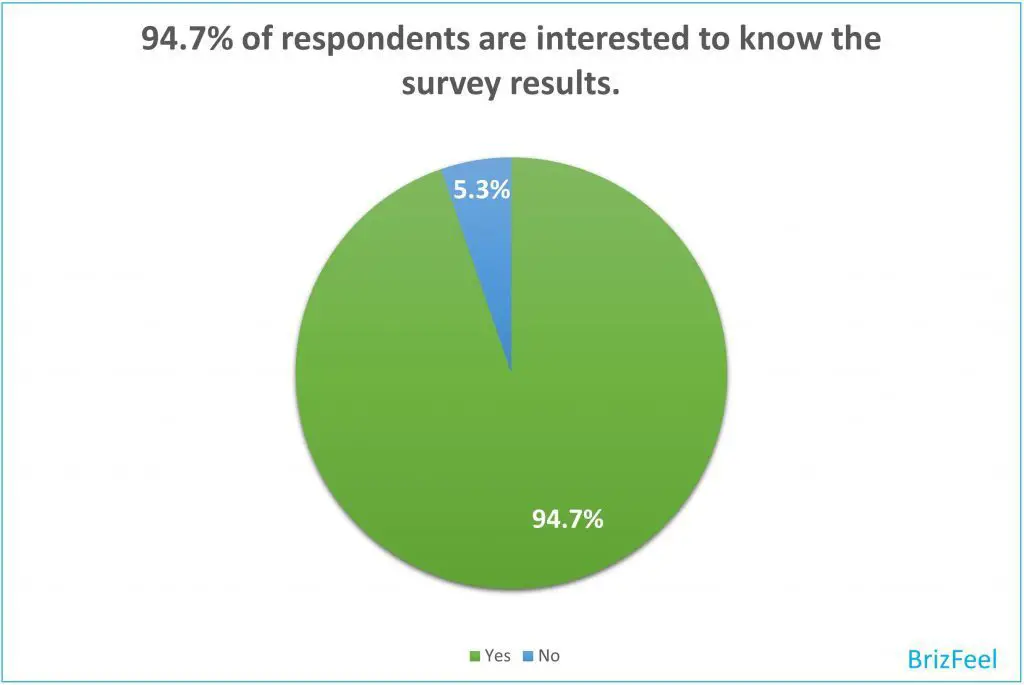
Survey question: Would you like to know the final survey results once the survey is finalized?
Survey result:
- YES – 94.7%
- NO – 5.3%
Insight:
People are curious about what others think and their answers.
As an idea, you may publish a post regarding the survey results and send it to the participants.
Key takeaway: Respondents are interested in the survey results.
13. 71.9% of respondents expect the improvement to be rolled out in 3 months.

Survey question: How long would you expect the changes or improvements after the survey is completed?
Survey result:
- Within 3 months – 71.9%
- 3 to 6 months – 18.7%
- 6 to 12 months – 8.1%
- Above 12 months – 1.3%
Insight:
People are eager to see the improvements or changes being implemented as soon as possible.
However, 3 months is quite short for a large-scale update, especially if involves complex technical implementation.
Therefore, an earlier announcement or teaser regarding the improvements that are working on is recommended to keep them excited and engaged.
By doing so, you are letting them know that their voices are heard, and you are working on it.
Key takeaway: Keep your audience updated with the company’s progress.
Why Survey is Important?
We often survey our readers and consumers because we know the importance of surveys, and how surveys help in optimizing and improving our marketing campaign and business approach.
Now, let’s discuss why you should conduct surveys and how surveys help in your business.
Surveys Provide Unbiased Data
Surveys provide unbiased information for decision-making.
Numbers don’t lie, and surveys give actual numbers that take out the guesswork.
When done right, the survey data based on people’s opinions and experiences can be used to make important business decisions such as new features, new products or services, future changes, and more.
By knowing what people want, you’ll have a higher chance to win and prevent losses due to wrong decisions.
You shouldn’t make important decisions based on “gut feelings”, as that’s one of the reasons why many businesses failed after making bad decisions.
Surveys allow you to gather unbiased data and make key decisions based on analyzed results so you can focus on important areas instead of wasting time and resources somewhere else.
Surveys Tell You the ‘WHY’
In this digital era, data is highly important for companies and individuals to run their businesses and marketing campaigns effectively.
In the business and marketing world, many rely on implicit data which is gathered through analysis and observation of others’ behavior.
While implicit data can provide you some ideas and understanding regarding the area of study, however, there is a significant limitation of what implicit data can tell us.
For instance, when a housewife is using his husband’s Facebook account to view cooking-related contents, Facebook’s powerful algorithms wouldn’t know about it and so the data collected is inaccurate.
When a visitor leaves a website, Google Analytic knew the visitor is left, but it couldn’t answer why the visitor left, is it because of the site’s content, real-world interruption, or other reasons.
When a man adds a cosmetic product to the cart on Amazon, its recommendation engine wouldn’t know the item is for his wife’s present and will populate the product recommendation area with woman cosmetic products.
Amazon knew the user add the cosmetic product to the cart, but they don’t know why he adds the product.
The implicit data could be useful, but there are flaws and vagueness on it and you shouldn’t make an important decision solely based on implicit data.
On the other hand, explicit data from surveys will tell you the ‘Why’.
Surveys can uncover the true reason behind the behavior.
In short, explicit data is fully revealed information that is more reliable to understand the reasons behind the behaviors.
Surveys Provide Benchmarks and Trends
The survey data gathered from the respondents will give you the benchmarks to plan for future actions.
Besides, by asking the same questions at different points in time, you can better understand the current trends based on the differences and changes.
Surveys Provide Voices
Another importance of surveys is it gives your audience, users, customers, or readers a medium to voice out their opinions, experiences, concerns, complaints, feedback, and ideas.
This is the only way you will know what is actually important to them.
Also, surveys allow respondents to involve in a discussion of important topics.
When they are involved, the engagement, trust, and loyalty will increase as they will feel like they are part of it.
Summary of the Importance of Surveys
The importance of surveys toward a company’s growth is undeniable.
Surveys provide numbers, tell you the ‘why’, provide benchmarks and trends, and give respondents a medium to voice out.
The explicit data from surveys is irreplaceable as there are no other methods that can provide such accurate information.
Conclusion
This survey research is done to stress the importance of the survey and show you the current survey statistics and facts.
If done right, surveys can provide a lot of advantages for your businesses and you should structure the survey strategically to get the best overcome from it.
After all, the survey is still the best way to understand the needs of your customers, readers, users, or audiences.
Read Next:
Great survey data, thank you so much for conducting the survey research, our company was thinking about surveying our prospects and customers, and this research is a great help for us.
Glad it helped!