
In this digital era, everything is data.
And we believed data is important to your business success.
So we have researched, validated, and compiled 160 internet facts and statistics to present you the past, current, and future of the internet world.
As the internet world is changing rapidly, it’s crucial to get updated on the latest statistics and facts and apply them to your business.
Make use of these important data, facts, and statistics to grow your business’s conversion rate and revenue.
Here are the latest internet facts and statistics:
Internet Facts & Statistics:
Internet Facts & Statistics
Here is the most complete collection of the latest facts and statistics about the internet.
You will find interesting facts about the internet, mobile internet statistics, e-commerce facts, social media stats, facts on internet safety, cybersecurity, future trends, and more.
Internet Users Facts & Statistics
1. The number of internet users worldwide was 4.57 billion as of Jan 2020. (Internet World Stats, 2020)
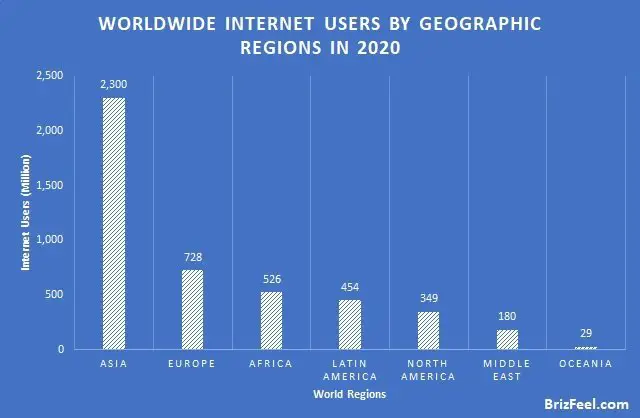
2. Asia has the largest internet user base of about 2.3 billion (50.33%) with the majority of them from East Asia, followed by Europe at 727.81 million (15.93%), Africa at 526.37 million (11.52%), and Latin America at 453.7 million (9.93%). (Internet World Stats, 2020)
3. North America only accounted for 7.63% of internet users worldwide, with 348.91 million users and ranked number 5 in the world. (Internet World Stats, 2020)
4. The Middle East has an internet user base of 180.5 million (3.95%) and Oceania has about 28.78 million (6.3%). (Internet World Stats, 2020)
5. Africa has the highest internet user base growth rate of 11,559%, rising from 4.51 million in 2000 to 526.71 million in 2020. (Internet World Stats, 2020)
6. The Middle East region is the runner up for the growth rate of the internet user base, with 5,395% growth from 3.28 million in 2000 to 183.21 million in 2020. (Internet World Stats, 2020)
7. Among the Asia countries, China has the largest internet user base at 854 million (37.13%), followed by India at 560 million (24.24%), Indonesia at 171.26 million (7.45%), and Japan at 118.63 million (5.16%). (Internet World Stats, 2020)
8. For Europe countries, Russia leads the internet user base at 116.35 million (15.99%), followed by Germany at 79.13 million (10.87%), Turkey at 69.11 million (9.5%), the United Kingdom at 63.54 million (8.73%), France at 60.42 million (8.3%), and Italy at 54.8 million (7.53%). (Internet World Stats, 2020)
9. For Africa countries, Nigeria has the highest number of the internet user base at 126.08 million (23.95%), followed by Egypt at 49.23 million (9.35%), Kenya at 46.87 million (8.9%), South Africa at 32.62 million (6.2%), Algeria at 25.43 million (4.83%), Morocco at 23.74 million (4.51%), and Ethiopia at 20.51 million (3.9%). (Internet World Stats, 2020)
10. In Latin America, Brazil has the largest internet user base at 149.06 million (32.85%), followed by Mexico at 88 million (19.4%), Argentina at 41.59 million (9.17%), Colombia at 31.28 million (6.89%), and Peru at 22 million (4.85%). (Internet World Stats, 2020)
11. For North America, the United States has the highest number of internet users at 292.89 million (83.94%), followed by Canada at 34.56 million (9.91%). (Internet World Stats, 2020)
12. Among the Middle East countries, Iran leads the internet user base at 67.6 million (36.9%), followed by Saudi Arabia at 31.86 million (17.39%), Iraq at 21.28 million (11.62%), and the United Arab Emirates at 9.53 million (5.2%). (Internet World Stats, 2020)
13. In Oceania, Austria has the largest internet user base at 21.71 million (75.43%) and followed by New Zealand at 4.35 million (15.11%). (Internet World Stats, 2020)
Internet Usage Facts & Statistics
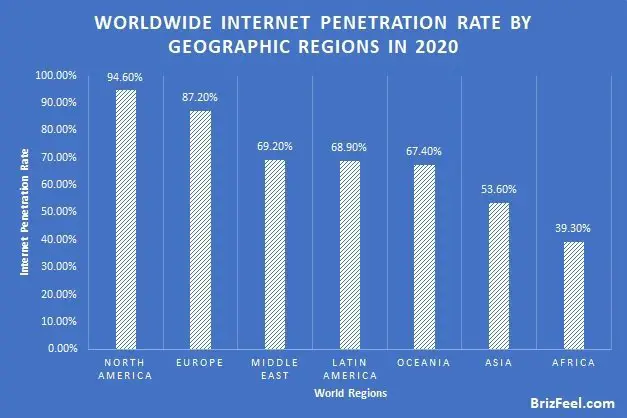
14. The global average internet penetration rate was 58.7%. (Internet World Stats, 2020)
15. Northern Europe has the highest internet penetration rate of 94.6%, followed by Europe with 87.2%, the Middle East with 69.2%, Latin America with 68.9%, and Oceania with 67.4%. (Internet World Stats, 2020)
16. Asia only has only a 53.6% internet penetration rate despite the largest internet user base. (Internet World Stats, 2020)
17. North Korea is the country with the lowest internet penetration rate at only 0.08%, with 20k internet users out of 25.78 million populations. (Internet World Stats, 2020)
18. The second-lowest for internet penetration rate was Western Sahara at 4.7%, with 28k internet user base out of 597,339 population, followed by Chad at 6.3%, with 1.3 million internet users out of 16.42 million population, both countries are from Africa. (Internet World Stats, 2020)
19. Among the Asia countries, South Korea leads the internet penetration rate at 96%, followed by Brunei Darussalam at 95.3%, Japan at 93.8%, Taiwan at 92.6%, and Hong Kong at 89.3%. (Internet World Stats, 2020)
20. Whereas in Europe, the country with the highest internet penetration rate is Iceland at 99%, followed closely by Andorra at 98.9%, and Norway at 98.4%. (Internet World Stats, 2020)
21. In Africa, Kenya has the highest internet penetration rate at 87.2%, followed by Libya at 74.2%, Seychelles at 72.5%, and Mauritius at 67%. (Internet World Stats, 2020)
22. For Latin America, Aruba has the highest internet penetration rate at 97.2%, followed by Argentina at 92%, Curacao at 93.1%, Paraguay at 88.5%, Uruguay at 87.9%, and Costa Rica at 85.9%. (Internet World Stats, 2020)
23. In North America, Bermuda stayed on top of the internet penetration rate at 98.4%, followed by Canada at 92.7%, Greenland at 91.8%, and the United States at 89%. (Internet World Stats, 2020)
24. For Middle East countries, Qatar leads the internet penetration rate at 99.6%, followed closely by Kuwait at 99.1%, United Arab Emirates at 96.4%, Bahrain at 94.9%, and Saudi Arabia at 91.5%. (Internet World Stats, 2020)
25. In Oceania, Niue has the highest internet penetration rate at 91.2%, the second is New Zealand at 90.8%, and the third is Australia at 86.5%. (Internet World Stats, 2020)
26. 75% of internet searchers never scroll past the first page of search engine results pages (SERP). (Forbes)
27. 71% of buyers begin with unbranded generic searches. (ThinkWithGoogle)
28. Ad-blocking is widely used by 73% of North American adults, resulting in an estimated $75 billion losses to businesses by 2020. (BrizFeel, 2020)
Internet Traffic Facts & Statistics
29. Google processes more than 7 billion search queries daily. (Google, 2020)
30. There is more automated traffic than human traffic on internet. (Imperva, 2020)
31. 50.33% of all browser-based searches on Google result in zero clicks. (Sparktoro, 2019)
32. 94% of worldwide searches are from Google property. (Sparktoro, 2019)
33. Automated sources accounted for 56% of all internet traffic worldwide, the sources including but not limited to scapers, bots, spams, and hacks. (SandVine, 2018)
Internet Browser Statistics
34. Google Chrome dominates the internet browser share with 61.77% user base, followed by Safari at 15.09%, Firefox at 4.92%, Opera at 3.15%, and Internet Explorer at 2.81%. (Statista, 2020)
35. 53% of users have 1 to 5 tabs open on their browsers, followed by 6 to 15 tabs from 26% of users, and 8% of users have 16 to 25 browser tabs open at any given time. (Digital Trends, 2019)
36. Firefox accounted for 8% of web traffic from Windows and Macs, whereas Apple Safari accounted for 7.9% of web traffic from Windows and Macs. (ZDNet, 2018)
37. Chrome has 2 billion installed and 1 billion monthly users worldwide. (CNET, 2018)
38. Google Chrome has a 62% mobile browser user share worldwide, followed by Apple Safari at 29%. (ComputerWorld)
Mobile Internet Usage Facts & Statistics
39. 53% of emails are read on mobile devices. (Litmus)
40. Personalized subject lines in email increase the open rate by 27%. (BrizFeel, 2020)
41. 91% of people in the United Arab Emirates use their phone to access the internet, followed by Singapore at 88%, and Saudi Arabia at 86%. (Statista, 2019)
42. 57% of people in the United States use their phones to access the internet. (Pew Research Center, 2019)
43. 80% of internet users have a mobile phone. (Pew Research Center, 2019)
44. The global mobile population is 4 billion unique users as per Q1 2019. (Statista, 2019)
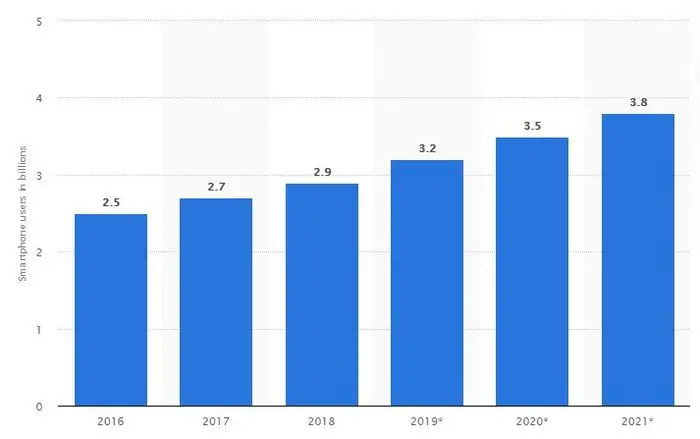
45. The number of smartphone users worldwide was 3.2 billion and is expected to hit 3.5 billion and 3.8 billion marks by 2020 and 2021 respectively. (Statista, 2020)
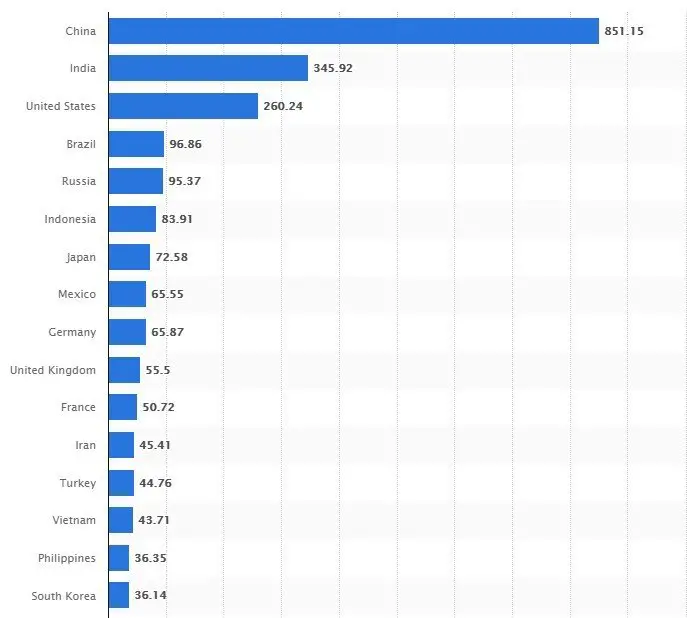
46. As of Q3 2019, China has the highest number of smartphone users at 851.15 million, followed by India with 345.92 million and the United States with 260.24 million. (Statista, 2019)
47. Mobile users spent 89% of their mobile time on apps and 11% on websites. (Nielsen)
48. American adults spent more than 3 hours on mobile devices every day. (BrizFeel, 2020)
Mobile Internet Traffic Facts & Statistics
49. Mobile devices excluding tablets accounted for 52.6% of web page views worldwide as of Q4 2019. (Statista, 2020)
50. In Asia, over 61.7% of web page views were generated via mobile. (Statista, 2020).
51. Mobile internet traffic has surpassed desktop internet traffic in 2019. (BrizFeel, 2020)
52. Google dominates mobile search traffic at 96%. (NetMarketShare, 2019)
Worldwide Domain Name Facts & Statistics
53. There are over 360 million domain names registered as of Q1 2020. (Verisign, 2019)
54. The .COM and .NET TLDs accounted for 157.4 million (44%) of the domain name registered. (Verisign, 2019)
55. Among the top-level domain (TLD), .COM has the highest registration at 144 million, followed by .TK at 25.1 million, .CN at 23 million, .DE at 16.3 million, .NET at 13.4 million, .UK at 13.3 million, .ORG at 10 million, .TW at 6.8 million, .NL at 5.9 million, and .RU at 5.7 million. (Verisign, 2019)
56. There are a total of 1,508 domain extensions (TLDs) as of Q1 2020. (Verisign, 2019)
57. There are 154.61 million domains hosted worldwide as of Q2 2019. (Statista, 2019)
58. There are 20 million new domain names registered in the third quarter of 2019, a 4% increment from the second quarter of the same year. (Verisign, 2019)
59. The highest domain sale is Cars.com at $872 million valuations as part of the business deal. (US SEC)
60. The second highest domain sale is CarInsurance.com at $49.7 million, followed by Insurance.com at $35.6 million, VacationRentals.com at $35 million, PrivateJet.com at $30.18 million, Voice.com at $30 million, Internet.com at $18 million, 360.com at $17 million, and Insure.com at $16 million. (BrizFeel, 2020)
Websites Facts and Statistics
61. There are over 1.74 billion websites on the internet in 2020 Q1. (Statista, 2020)
62. The first web page was published on August 6, 1991, by Tim Berners-Lee with the URL ‘http://info.cern.ch/hypertext/ WWW/TheProject.html’. (Google)
63. 59.7% of websites worldwide used HTTPS. (W3Techs)
64. 94.7% of websites worldwide used CSS. (W3Techs)
65. 5.5% of websites worldwide used HTTP/3. (W3Techs)
66. WordPress is used by 35.9% of all websites as of Q1 2020. (W3Techs, 2020)
67. Among the popular content management systems (CMS), WordPress leads the market share by 63.2%, followed by Joomla, Shopify, Drupal, and Squarespace. (W3Techs)
68. WooCommerce is used by 16.9% of all the WordPress websites. (W3Techs)
69. 51.3% of websites do not use any content management system (CMS). (W3Techs)
70. For high traffic sites, the most used CMS is Drupal, followed by WordPress, Shopify, Joomla, and Squarespace. (W3Techs)
71. The three most popular website builders are Squarespace, Wix, and Weebly, which created 5.6% of the top 1 million websites. (CNET, 2020)
72. Globally, $500 million is lost every year due to a 7% drop in conversion rates caused by slow websites. (BrizFeel, 2020)
73. Websites on the first page of Google SERP have an average load time of 2 seconds. (BrizFeel, 2020)
74. 40% of consumers will leave a page if it takes longer than 3 seconds to load. (Forbes, 2019)
75. 80% of top Alexa websites are optimized for mobile. (mobiForge, 2017)
Blogging Facts and Statistics
76. Average 5.76 million blog posts are published on WordPress daily on the internet. (WordPress)
77. Globally, there are over 600 million blogs in Q1 2020. (Statista, 2020)
78. There are about 1.7 million blogs in the United States in Q1 2020. (Statista, 2020)
79. Long-form blog posts generate 9 times more conversion than short-form posts. (BrizFeel, 2020)
80. Blogging and social media are the two most popular content marketing strategies with 67% utilization, followed closely by case studies at 63%. (BrizFeel, 2020)
81. 78% of B2B buyers use case studies when research for purchase. (TrustRadius)
82. 57% of consumers in the United States have made a purchase based on the recommendations from blogs. (BrizFeel, 2020)
83. 83% of online consumers in the United States trust the information on blogs. (BrizFeel, 2020)
Web Hosting Statistics and Facts
84. 50% of websites are hosted on either Apache or Nginx open-source web server software. (ZDNet)
85. The global web hosting market is projected to reach $216.59 billion by 2025. (Adroit Market Research)
86. The Southeast Asia web hosting market is projected to reach $4.67 billion by 2025. (Adroit Market Research)
87. There are 338,561 web hosting services providers worldwide as of Q2 2019. (Statista, 2019)
88. The dedicated web hosting market is expected to reach $6.53 billion globally by 2020. (Statista, 2020)
89. Cloud computing and cloud hosting market is on an uptrend and is expected to hit $156.4 billion by 2020. (Statista)
90. Godaddy has the largest share of the web hosting market at 6.6%, followed by Amazon Web Services (AWS) at 5.9%, Endurance International Group (EIG) at 4.9%, OVH at 4.2%, and Google Cloud at 4.1%. (W3Techs)
91. The revenue of Endurance International Group Holdings, Inc (EIG) was $1.145 billion in 2018 with a net income of $4.5 million, compared to a net loss of $99.8 million for the previous fiscal year. (Globenewswire)
92. Endurance International Group Holdings, Inc (EIG) has approximately 4.802 million subscribers on its platform as of Q1 2019, declined from 4.852 million in Q4 2018, and 5.051 million in 2017. The average revenue per subscriber (ARPS) for 2018 was $19.37, compared to $18.82 for 2017. (Globenewswire)
Internet Advertising Facts & Statistics
93. Digital advertising accounted for over 240 billion dollars, about 51% of all advertising spent globally in 2019. (Statista, 2019)
94. Worldwide digital ad spending is projected to reach over $375 billion by 2021. (eMarketer)
95. Google has the largest share of total digital ad spending in the United States at 37.2%, followed by Facebook at 19.6%. (eMarketer, 2019)
96. Search advertising is the most popular type of digital advertising. (BrizFeel, 2020)
97. 80% of internet users ignore Google ads. (Search Engine Land)
98. Small businesses spend between $9k to $10k monthly on Google PPC. (WebFx)
99. Internet users see over 1,500 banner ads monthly on average. (BrizFeel, 2020)
Mobile Advertising Facts & Statistics
100. Google accounted for 32.4% of total mobile ads spent, followed by Facebook at 24.6%. (eMarketer)
101. Over 60% of search advertising is served on mobile. (BrizFeel, 2020)
102. 70% of mobile users hate mobile ads. (BrizFeel, 2020)
103. Mobile ad spend is expected to reach over $247 billion globally by 2020 (Statista, 2019).
104. Mobile advertising accounted for 72% of all digital ad spending in the United States (Statista).
105. Mobile search ad spending in the United States was estimated at 28.12 Billion in 2019 (Statista).
Ecommerce Facts & Statistics
106. A one-second delay in page load time will cost a 7% drop in e-commerce conversions. (Akamai)
107. In the United States, 16% of the total retail sales are online spending. (United States Census Bureau, 2020).
108. Amazon accounted for more than one-third of e-commerce sales in the United States. (United States Census Bureau, 2020).
109. The United States’ e-commerce sales reached $187.25 billion in Q4 2019. (United States Census Bureau, 2020).
110. The e-commerce penetration rate is 18% of total retail sales in Q4 2019, 1.9% higher than the previous year’s same quarter at 16.1%. (United States Census Bureau, 2020).
111. In the United States, the total transactions on Amazon.com reached $221.95 billion in 2019, with 25.3% growth from the previous year at $177.10 billion. (Amazon, 2019)
112. Consumers spent a total of $601.75 billion online with merchants in the United States in 2019, with a 14.9% increase from $523.64 billion from the previous year (United States Census Bureau, 2020).
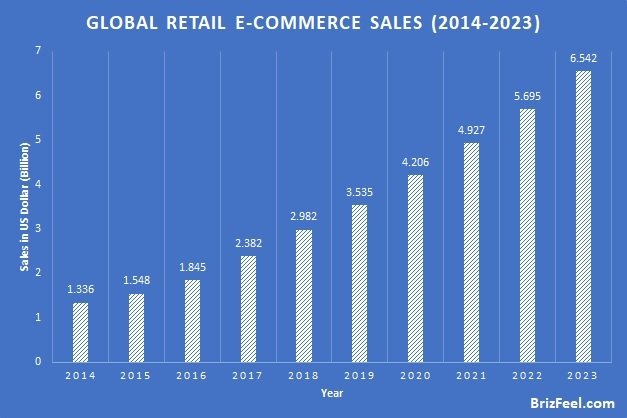
113. The retail e-commerce sales hit $3.535 trillion globally in 2019, and the amount is projected to reach $6.542 trillion in 2023. (Statista, 2020)
114. Online shopping is one of the most popular online activities around the globe. (BrizFeel, 2020)
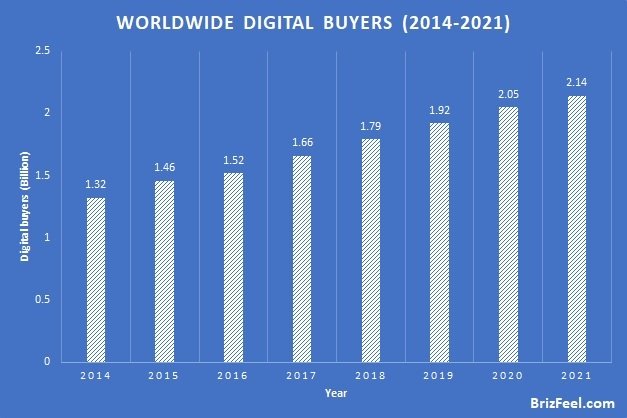
115. The number of digital buyers is expected to reach 2.05 billion worldwide, about 26% of the world population. (Statista, 2019)
116. Online grocery shopping is projected to reach $100 billion transactions by 2025 with a 20% grocery market share. (CNBC, 2019)
117. 25% of consumers will shop online for at least once a week. (BrizFeel, 2018)
118. Only 28% of small businesses in the U.S. are selling their products online. (Forbes, 2018)
119. 72% of consumers believe they will get a better deal online than in-stores. (BrizFeel, 2020)
120. High shipping costs will cause 31% of online shoppers to abandon their carts. (BrizFeel, 2020)
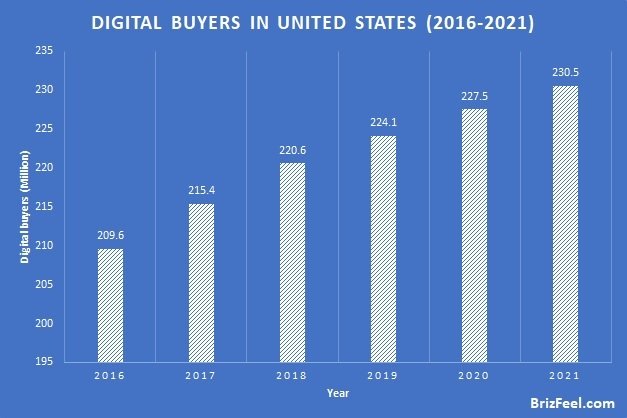
121. The number of digital buyers in the United States was 224.1 million in 2019 and is expected to reach 227.5 million by 2020. (Statista, 2020)
122. A product video can increase the product purchase rate by 144%. (Digital Commerce 360)
123. 500 million youngsters are now obsessed with watching 15-second-videos on Tik Tok. (FlexClip, 2022)
124. Estimated more than 40% of all online orders include free shipping. (BrizFeel, 2019)
125. Cart abandonment accounted for $18 billion in sales losses every year. (Dynamic Yield)
126. Some of the common reasons for cart abandonment are high shipping cost, not qualifying for free shipping, not ready to purchase, and slow website. (BrizFeel, 2019)
127. More than 45% of B2B technology buyers are between 25 to 34 years old. (TrustRadius)
Mobile E-commerce Facts & Statistics
128. 68% of smartphone and tablet users have attempted to purchase on their devices, however, two-third are failed to complete the transaction due to obstacles faced during checkout. (ThinkWithGoogle)
129. The cart abandonment rate is 97% for mobile and 70% for desktop. (WebFx)
130. Tablets have the highest add-to-cart rate at 8.58% on e-commerce websites. (Social Media Today)
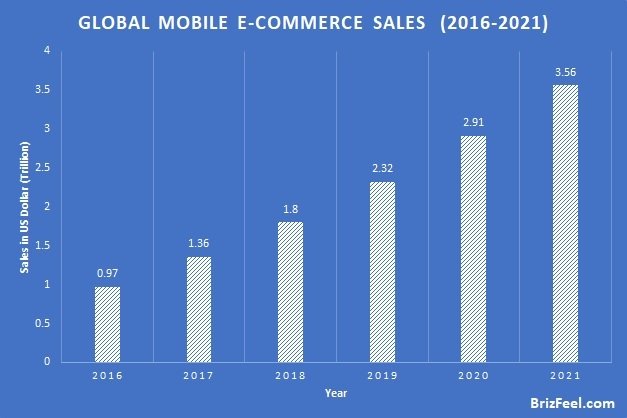
131. The mobile e-commerce growth rate is 33.8% annually on average since 2016. (Statista)
132. Mobile e-commerce sales are expected to hit $2.91 trillion by 2020, with a 25.43% increment from the $2.32 trillion recorded in 2019. (eMarketer, 2019)
Social Media Facts & Statistics
133. There are 2.77 billion social media users worldwide in 2019. (Statista, 2019)
134. 81% of marketers said their traffic is increased by investing 6 hours a week on social media marketing. (Social Media Examiner)
135. Infographics get 3 times more likes and shares than any other type of content on social media. (Hubspot)
136. The average attention span of social media users is 8 seconds. (NCBI)
137. LinkedIn is the most preferred social media platform for B2B audience at 89%, followed by Twitter at 86%, Facebook at 82%, YouTube at 67%, Instagram at 30%, and Pinterest at 12%. (DemandWave)
138. 71% of consumers are likely to recommend a brand to others if the social media service experience is good. (Lyfe Marketing, 2018)
139. Facebook accounted for 60% of all e-commerce referrals. (BrizFeel, 2020)
140. Instagram has a follower engagement rate of 4.21% for top brands, which is 58x higher than Facebook and 120x higher than Twitter. (Forrester Research)
141. Facebook has 2.5 billion monthly active users as of Q4 2019. (Statista, 2019)
142. Instagram has about 1 billion users as of Q4 2019. (Instagram, 2019)
143. LinkedIn has over 575 million users with more than 260 million monthly active users, and 40% of active users visit the platform daily. (Linkedin, 2020)
144. People spend an average of 144 minutes daily on social media. (GlobalWebIndex)
145. WhatsApp and Facebook Messenger are the top messaging services used by over 50% of internet users. (Facebook)
146. Snapchat has the highest usage among the Gen Z population with 38% of them regularly use it. (Snapchat)
147. Instagram stories are used by more than 400 million users every month. (Instagram)
148. More than 2 billion messages are communicated between users and brands every month. (Facebook)
149. 45.8% of users preferred to contact businesses through messaging than email. (ubisend)
150. Influencer marketing strategy in social media is trusted by over 90% of marketers. (Mediakix)
Internet Safety facts & statistics
151. 73% of cyber-attacks are executed for economic reasons. (Symantec)
152. Cybercrime damages are projected to cost $6 trillion in a year by 2021. (CSO)
153. There are about 4,000 ransomware attacks daily. (U.S. DOJ)
154. The average amount demanded by a ransomware attack is $1,077. (Symantec)
155. Cybercrime is the second-highest reported cybersecurity crime worldwide. (Symantec)
156. 0.76% of emails contain malware. (Symantec)
157. 93% of data breaches occur in minutes, and 83% are not discovered for weeks. (Verizon)
158. The largest data breach is 3 billion Yahoo user’s information was hacked in 2013. (Verizon)
159. Weak and stolen passwords are the most common cybercriminal tactics that accounted for 81% of cyber attacks. (Symantec)
160. More than 40% of cyber criminal attacks are targeted at small businesses. (Symantec)
References:
More research data and statistics: