With the growing e-commerce trends, we are curious about the current state of the retail world and how they affect the consumers online shopping behavior and spending behaviors.
We wanted to know more about the effects of the online shopping trend, internet, online purchase trends, and technologies towards the retail world, such as consumers preferences on retail shopping, what are their opinions on the shopping experience, and the future trends in consumers spending.
Not only us, we believed many of the online retailers, owners of brick-and-mortar shop, and omnichannel retailers would like to know about the latest e-commerce statistics as well.
So, we’ve surveyed over 30,000 consumers worldwide from aged 18 to 65.
Here’s what we found in the consumers online shopping behavior survey.
- A Summary of Our Most Interesting Survey Findings
- Consumers Shopping Preferences
- Consumers Online Shopping Behaviors
- Consumers Spending Behaviors
- Cart Abandonment Statistics (E-Commerce)
- Goods Delivery Survey
- In-Store Shopping Survey
- Amazon Survey (based on US & UK)
- Consumers Shopping Experience Feedbacks
- E-Commerce Trends
- Why Do People Shop Online?
- Consumer Survey Report Explained
A Summary of Our Most Interesting Survey Findings
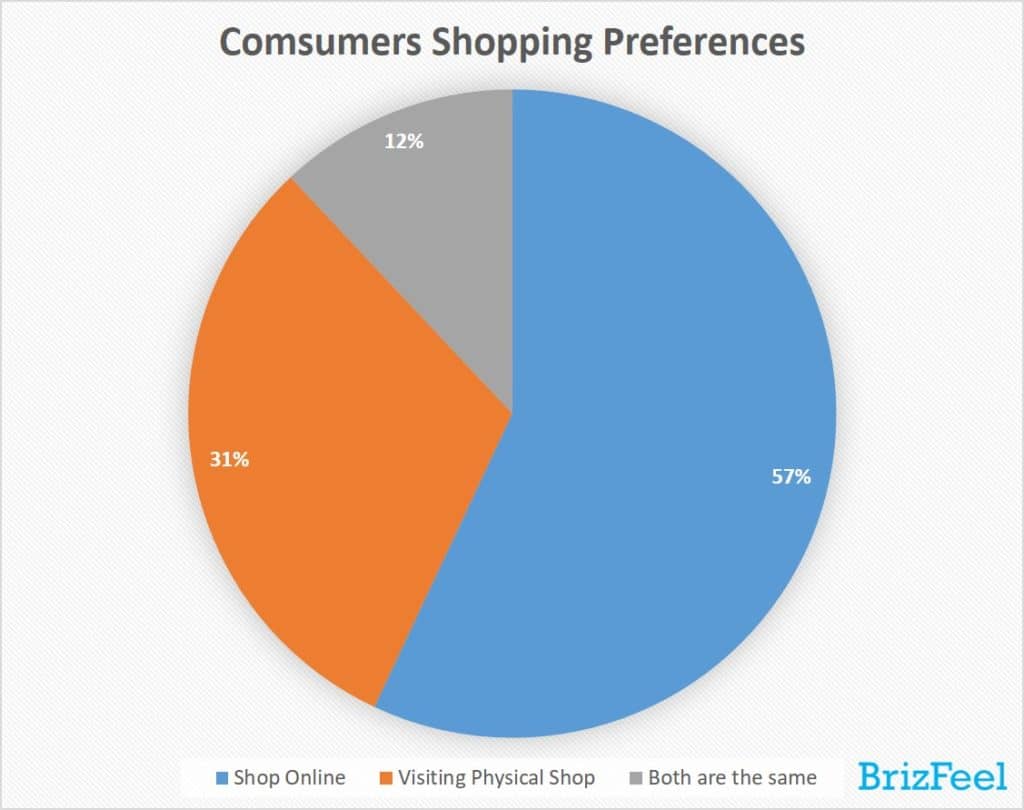
- 57% of consumers prefer to shop online, 31% of consumers prefer visiting the physical shop, while 12% of consumers said both ways are the same for them.
- 45% of consumers said they prefer to shop e-commerce websites with more testimonials.
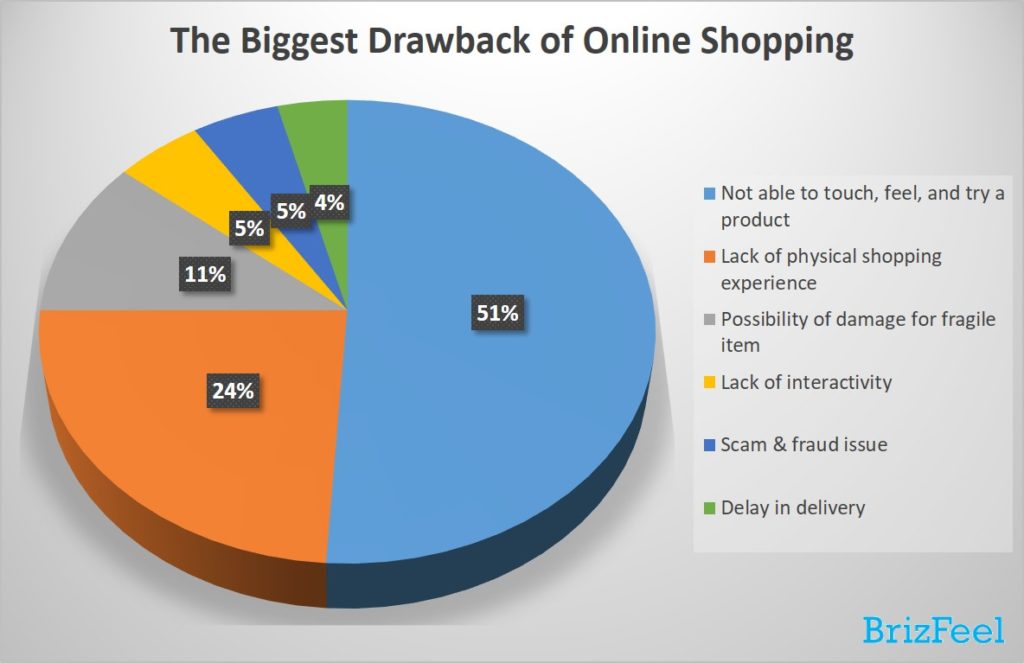
- Over half of the consumers said the biggest drawback of online shopping is not able to touch, feel, and try a product (51%), followed by lack of physical shopping experience (24%), the possibility of damage for a fragile item (11%), lack of interactivity (5%), scam & fraud issue (5%), and delay in delivery (4%).
- Consumers spend an average of 5 hours a week shopping online.
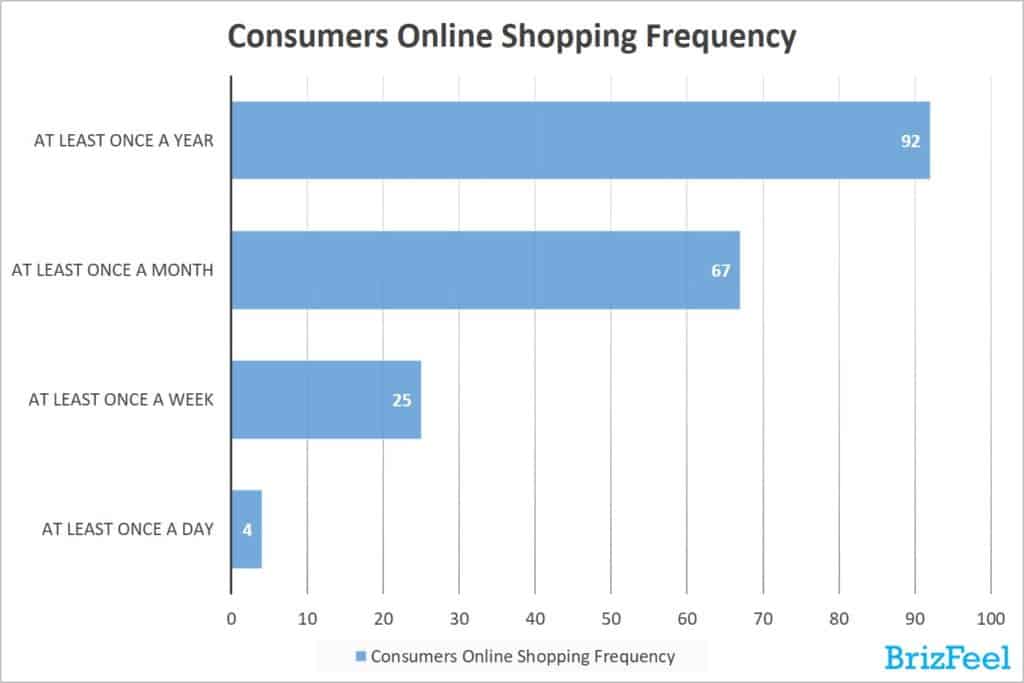
- 92% of consumers said they shop online at least once a year, 67% of consumers shop online at least once every month, 25% of consumers said they shop online at least once a week, and 4% of them said they shop online daily.
- The mobile phones are the top platform used for online shopping at 49%, followed by PCs at 43%, and tablets at 8%.
- 52% of consumers willing to share data in exchange for benefits such as reward, quicker service, and personalized offer.
- 87% of consumers have made an online purchase.
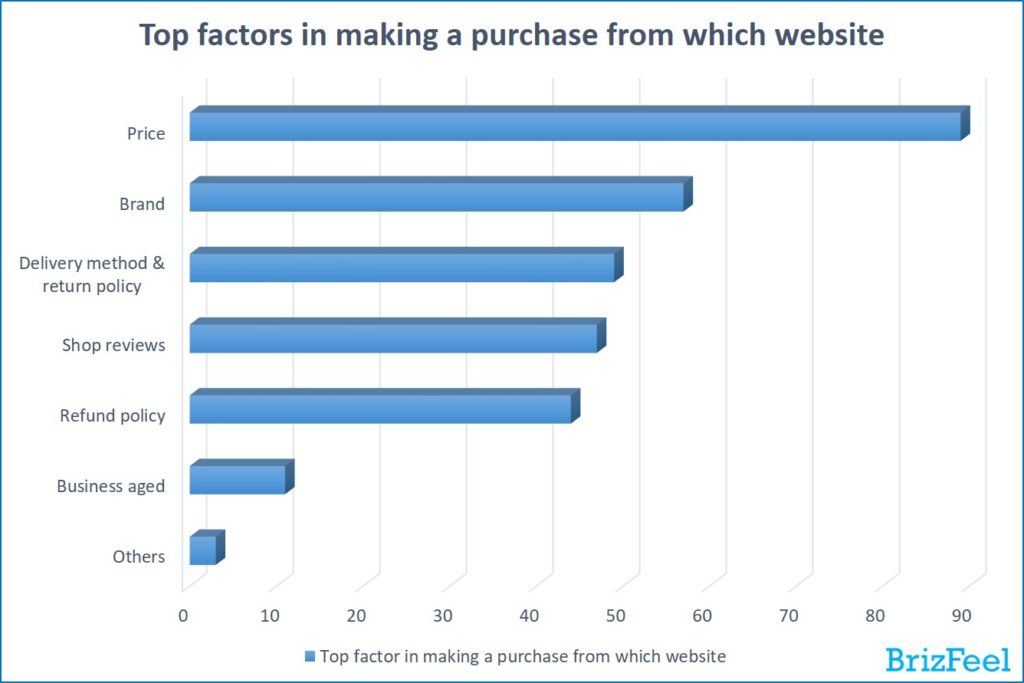
- The top factors in making a purchase from which website is the price (89%), followed by brand (57%), delivery method and return policy (49%), shop reviews (47%), refund policy (44%), business aged (11%), and others (3%).
- 46% of consumers made a purchase online for groceries.
- 91% of consumers are expecting to receive their goods within 3 business days.
- The most common factor to shop at a particular physical shop is the price (89%), followed by location (51%), stock availability (41%), brand (40%), good warranty & return policy (28%), good loyalty program (21%), parking availability (18%), and shop environment (12%).
- 92% of consumers said they used Amazon for their purchases.
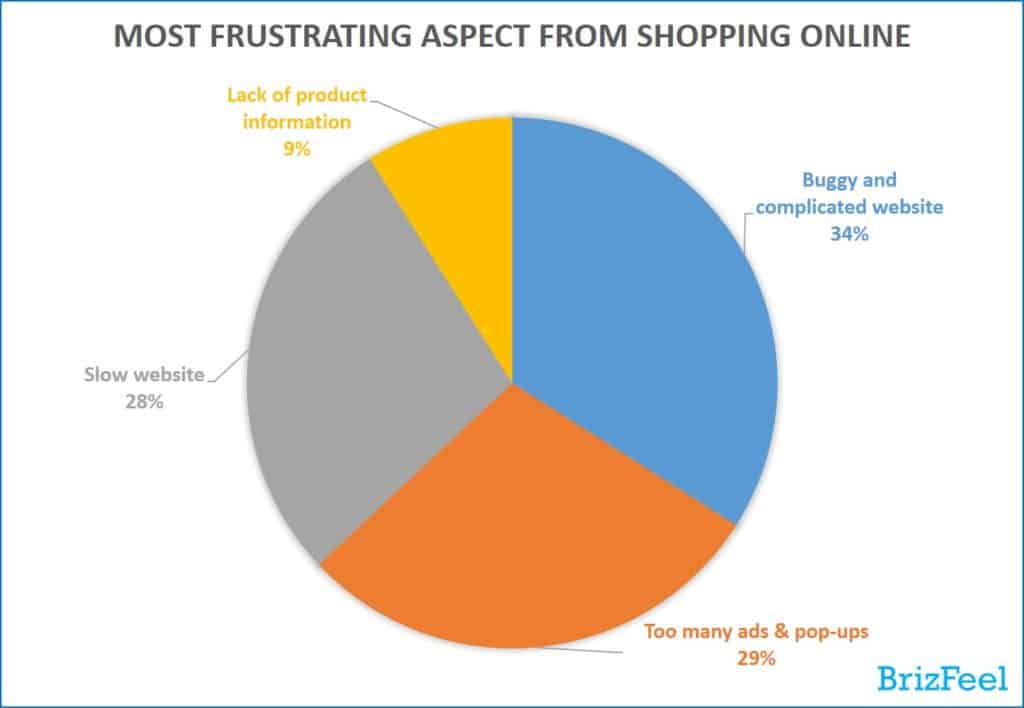
- 34% of consumers said that buggy and complicated websites are the most frustrating aspect when it comes to shopping online, followed by too many ads & pop-ups at 29%, slow website at 28%, and lack of product information at 9%.
- Only 27% of consumers said they will try to access a website again after they had trouble accessing it, while 73% of consumers said they will visit another website.
- 93% of mobile consumers said they prefer to shop online using mobile shopping apps over the mobile browser.
- 55% of female consumers said that they enjoy online shopping compared to 35% of male consumers.
- The top factor that drives customer loyalty for online consumers is customer experience (43%), followed by price (36%), brand (19%), and others (2%).
- 30% of consumers said they will spend more on products and services in the next 12 months, while 51% of consumers said they will spend around the same, and 19% said they will spend less.
- 56% of consumers spending more on buying products while 44% of consumers spending more on valuable experience.
Consumers Shopping Preferences
1. 57% of consumers prefer to shop online, 31% of consumers prefer visiting the physical shop, while 12% of consumers said both ways are the same for them.
2. 78% of consumers are likely to shop on large online retailers, compared to 52% on marketplaces, and 43% on smaller web-stores.
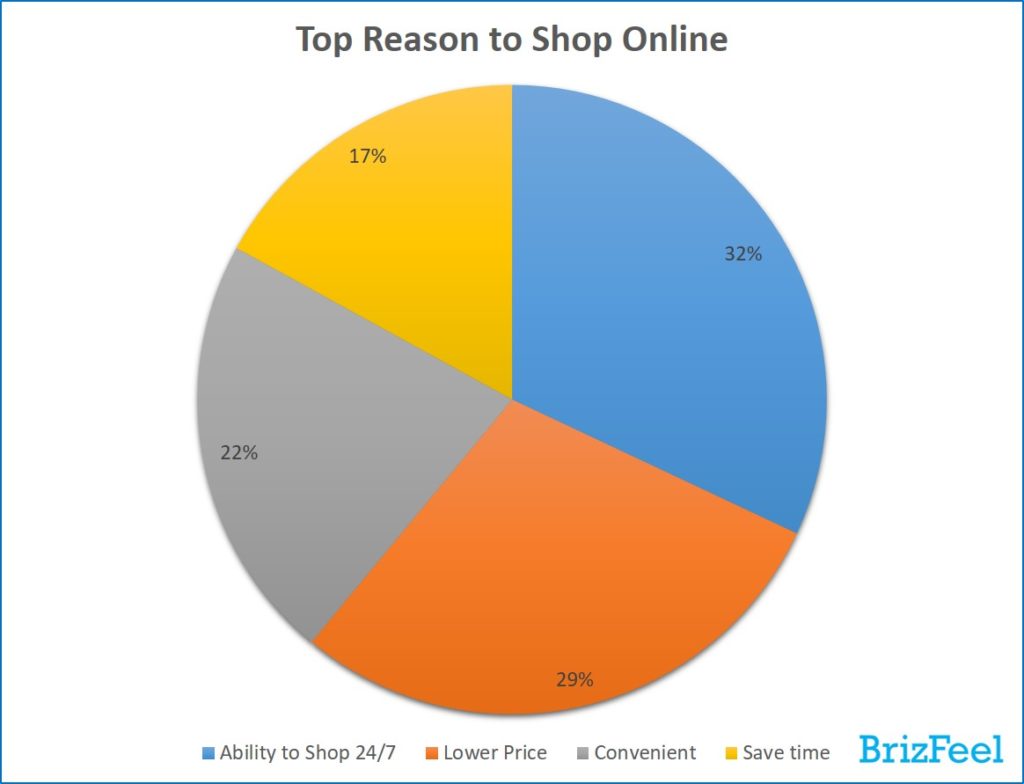
3. About one-third of consumers said the top reason to shop online is the ability to shop 24/7 (32%), followed by lower price (29%), convenient (22%), and save time (17%).
4. 45% of consumers said they prefer to shop e-commerce websites with more testimonials.
5. Over half of the consumers said the biggest drawback of online shopping is not able to touch, feel, and try a product (51%), followed by lack of physical shopping experience (24%), the possibility of damage for a fragile item (11%), lack of interactivity (5%), scam & fraud issue (5%), and delay in delivery (4%).
Consumers Online Shopping Behavior
6. Consumers spend an average of 5 hours a week shopping online.
7. 92% of consumers said they shop online at least once a year, 67% of consumers shop online at least once every month, 25% of consumers said they shop online at least once a week, and 4% of them said they shop online daily.
8. The mobile phones are the top platform used for online shopping at 49%, followed by PCs at 43%, and tablets at 8%.
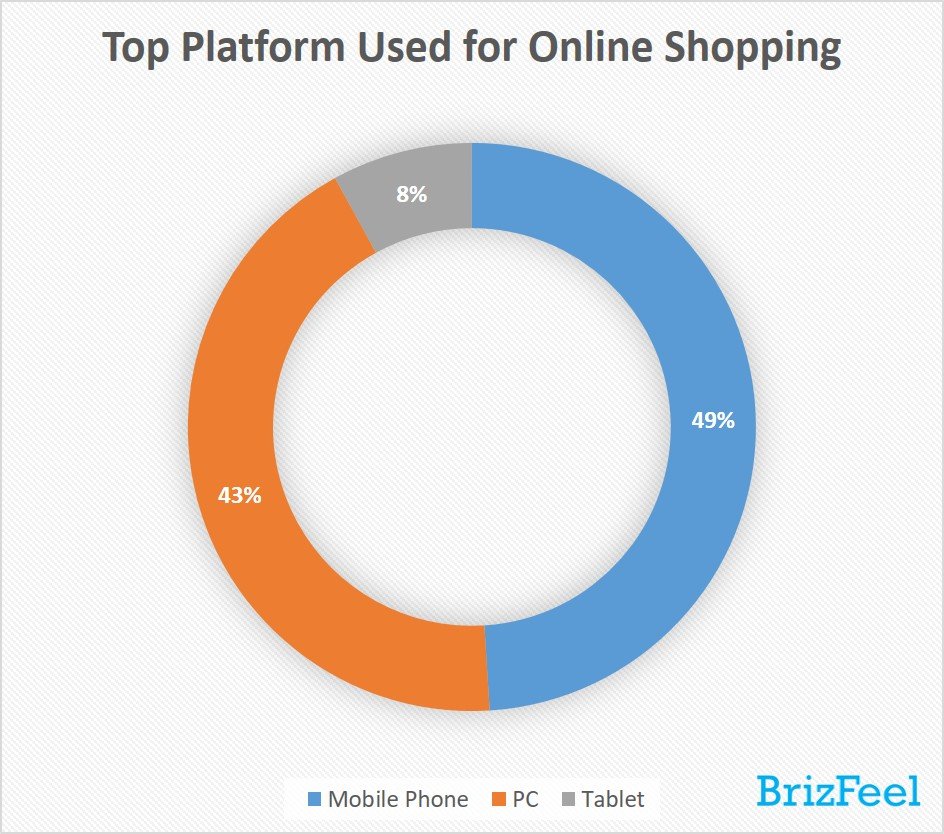
Insights: The use of smartphones for routine shopping has risen gradually over the past few years and overtake personal computers as the top platform choice for online shopping.
9. 62% of consumers will read the shipping & return policy before making a purchase.
10. 39% of consumers will look for recommendations from friends and family before purchase.
11. 27% of consumers said they used their smartphone to make monthly purchases, while 24% of consumers used their pc for monthly purchases.
12. Only 22% of consumers are likely to share a product or service on their social networks after purchase.
13. 54% of online consumers will perform a product search on search engines first, while the other 46% choose to go directly to the website they want.
14. 71% of consumers have redeemed a mobile offer and only 8% of consumers have redeemed a print offer.
15. 27% of consumers have posted a review or feedback online.
16. 52% of consumers willing to share data in exchange for benefits such as reward, quicker service, and personalized offer.
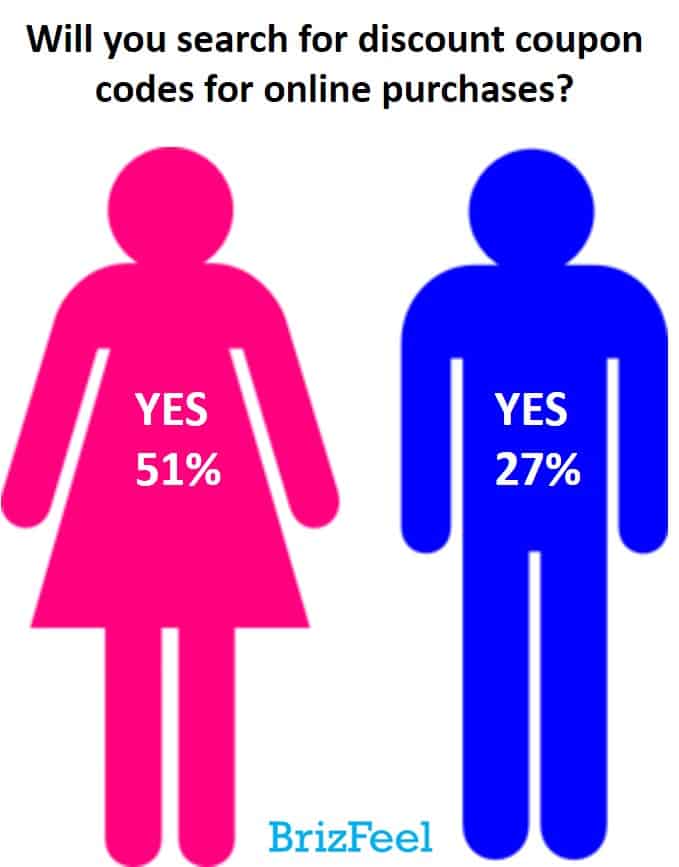
17. 51% of female consumers said that they will search for discount coupon codes for online purchases compared to 27% of male consumers.
18. 38% of consumers said they followed a company brand on social media.
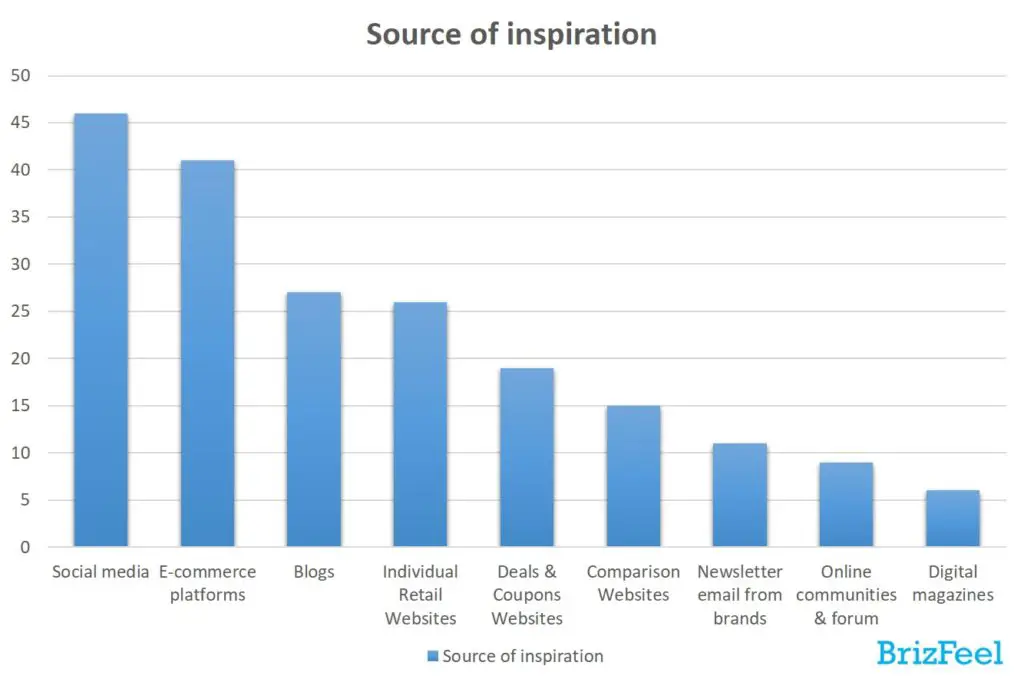
19. 46% of consumers said they find their inspiration for purchase using social media, followed by 41% using e-commerce platforms, 27% using blogs, 26% using individual retail websites, 19% using deals & coupons websites, 15% using comparison websites, 11% using newsletter email from brands, 9% using online communities & forum, and 6% using digital magazines.
Insights: Consumers are still relying on the crowd’s opinions in deciding what to buy.
Over the past decade, social media has changed the way consumers think and act.
For example, if a consumer is going to buy an RO water filter system, he may ask for an opinion on social media to make a decision.
Based on our survey, other users’ opinions posted on social networks have a stronger influence on consumers’ purchase decisions than retailers’ brands, promotions, and sales pitches.
We believed that consumers treat user-generated contents on social networks as authentic and genuine opinions.
With that being said, retailers shall pay attention to social media as part of their marketing efforts in order to catch up the shopping trends.
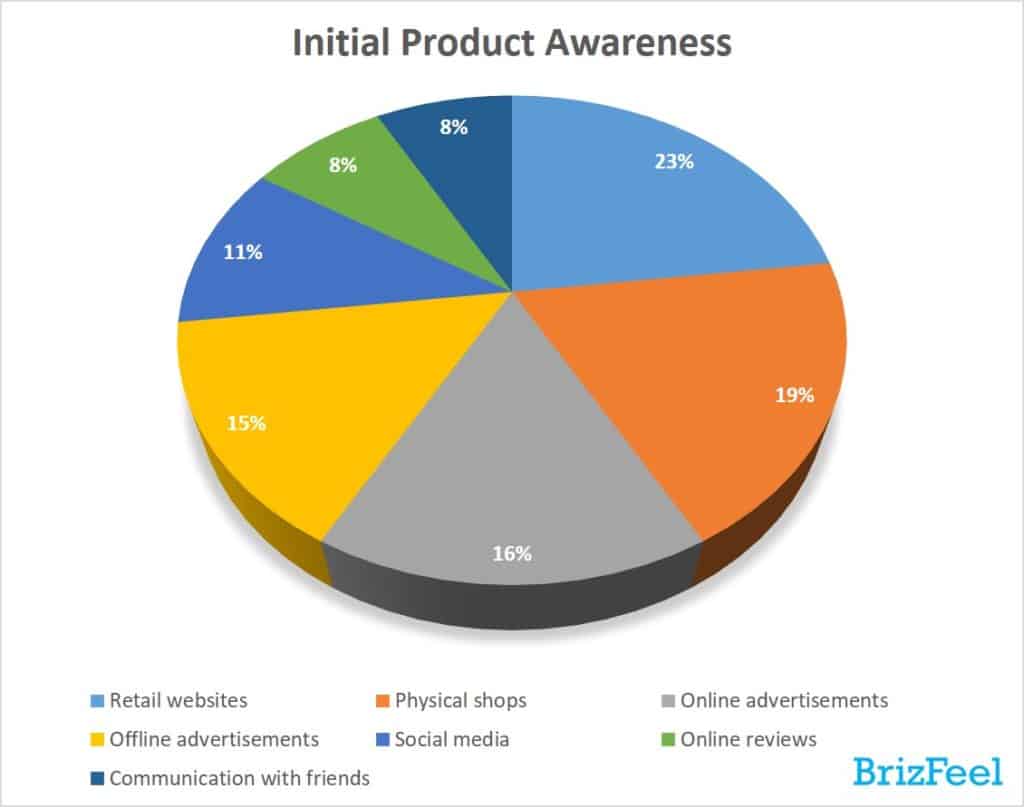
20. Retail websites are the most common sources of initial product awareness at 23%, followed by physical shops at 19%, online advertisements at 16%, offline advertisements at 15%, social media at 11%, online reviews at 8%, and communication with friends at 8%.
Consumers Spending Behaviors
21. 87% of consumers have made an online purchase.
22. 68% of consumers are more likely to purchase if they can watch a video explaining the product or service beforehand.
23. 94% of consumers will not buy from an online store with the majority of bad reviews, 27% of consumers said they will be affected by a minority of bad reviews, and 35% of consumers will not buy from an online store with no reviews at all.
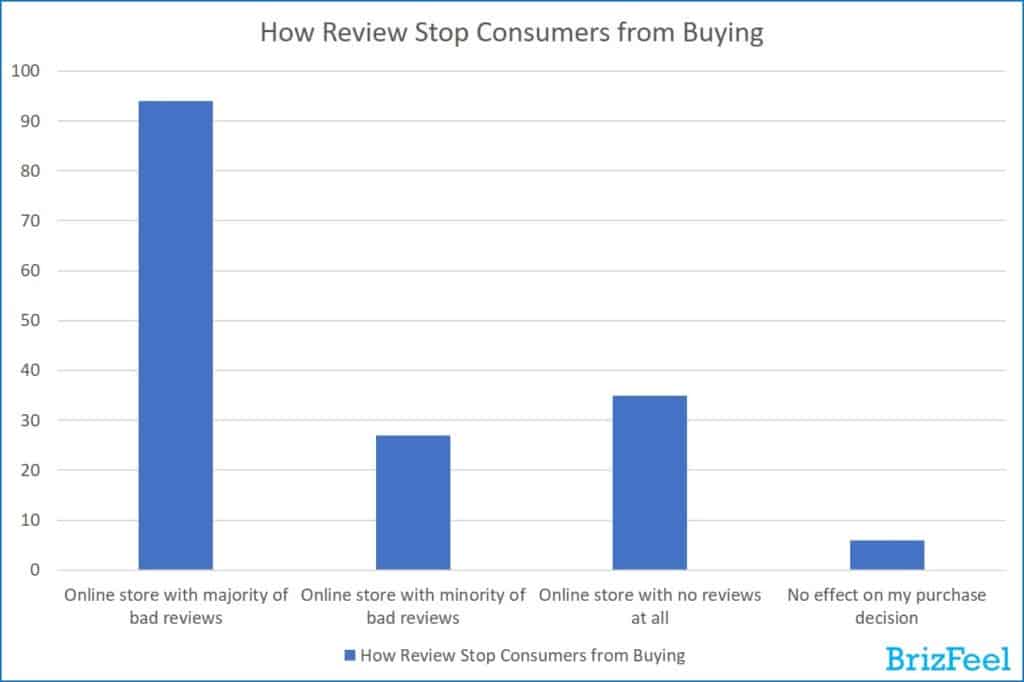
Insights: Reviews are important for an online store, even a minority of bad reviews is still better than no review.
24. The top factors in making a purchase from which website is the price (89%), followed by brand (57%), delivery method and return policy (49%), shop reviews (47%), refund policy (44%), business aged (11%), and others (3%).
25. 46% of consumers made a purchase online for groceries.
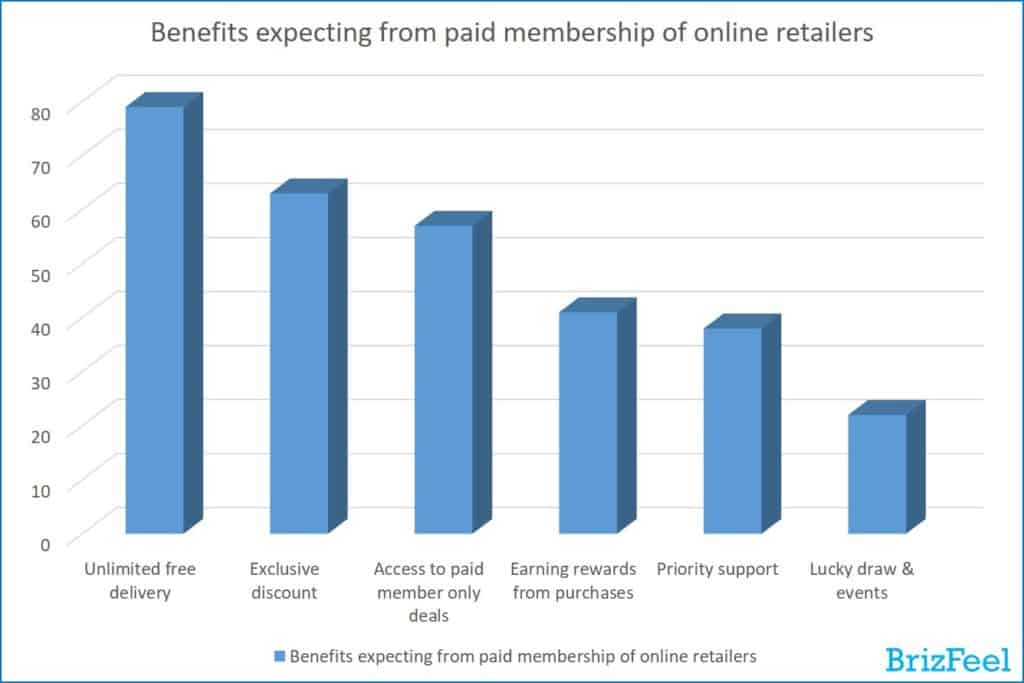
26. Consumers valued unlimited free delivery from paid membership more than others (79%), followed by exclusive discount (63%), access to paid member only deals (57%), earning rewards from purchases (41%), priority support (38%), and lucky draw & events (22%).
27. 72% of consumers only purchase from credible websites to reduce the risk of online scam & fraud, 57% said they only purchase using the payment gateway they trust, 49% said they will avoid clicking on ads, 35% choose to use different passwords for different websites, 27% said they only use a credit card with purchase protection, and 21% choose to purchase from their own country only to minimize the risk.
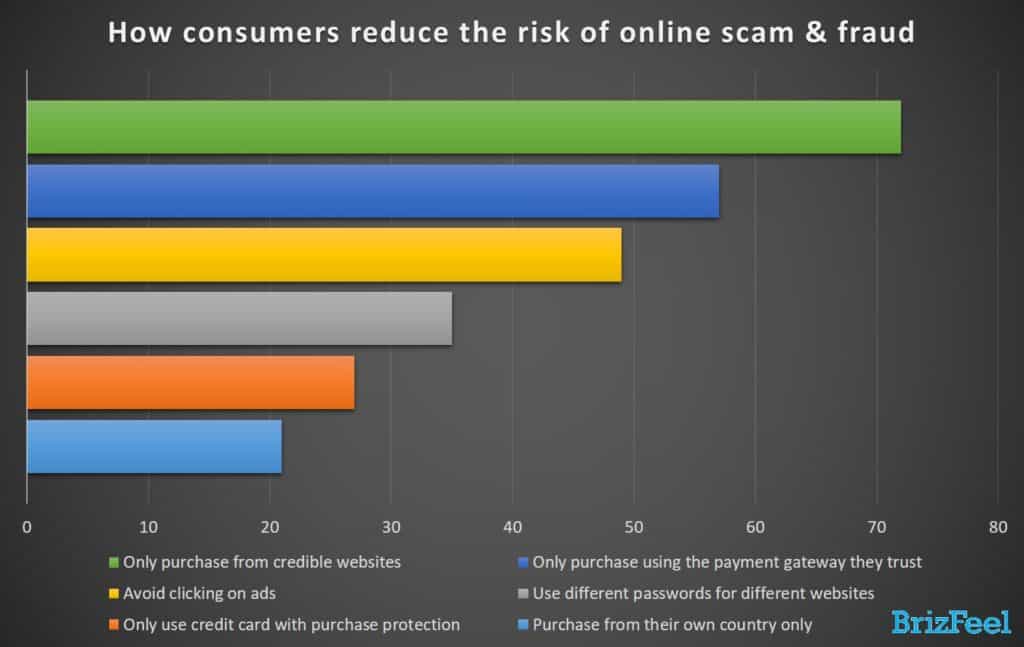
Insights: Consumers are more vigilant against online scams and frauds compared to the past. With that being said, it’s crucial to make sure your website is credible in the eyes of consumers.
Cart Abandonment Statistics (E-Commerce)
28. 78% of consumers had abandoned their cart at least once.
29. The top reason for cart abandonment is the high additional cost upon checking out at 67%, followed by a change of mind at 23%, payment issue at 6%, and other reasons at 4%.

Goods Delivery Survey
30. 91% of consumers are expecting to receive their goods within 3 business days.

Insights: Delivery speed playing a key role in pushing the e-commerce trends through improving consumers instant gratification shopping experience – whenever they want something, they can order it, and receive their items in 1-3 business days, rather than wait for their next shopping trip.
31. 37% of consumers said they are willing to pay extra for the same-day delivery.
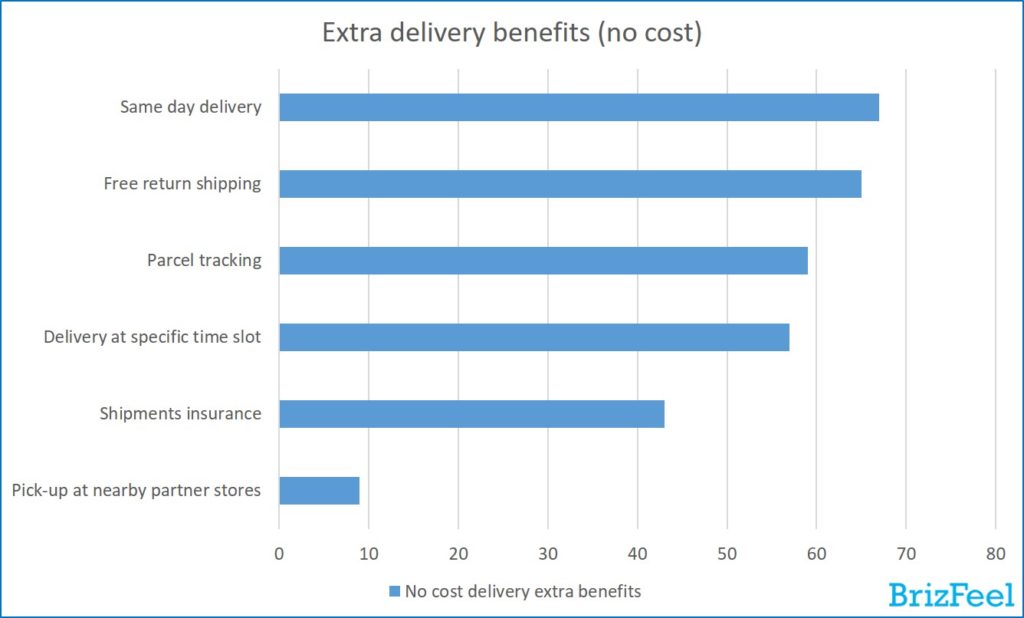
32. For the extra delivery benefits (offered at no additional cost), 67% of consumers preferred same-day delivery, followed by free return shipping at 65%, parcel tracking at 59%, delivery at specific time slot at 57%, shipments insurance at 43%, and pick-up at nearby partner stores at 9%.
33. Only 14% of consumers trust drone device as a delivery method for any product, while 17% said they can consider them for low-value products.
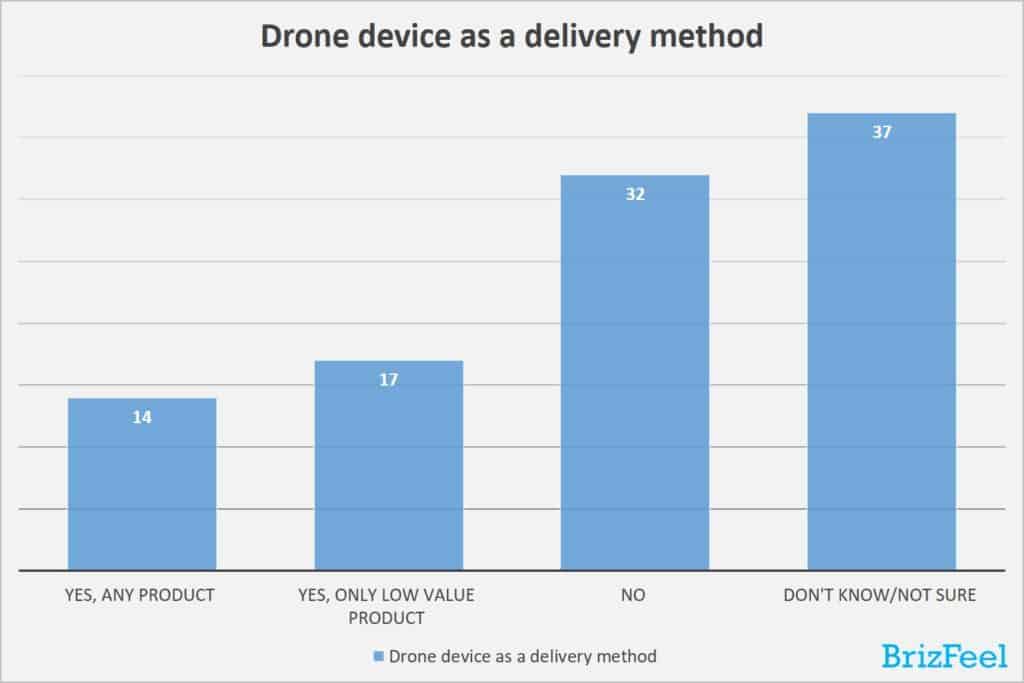
Insights: Consumers are not ready yet for drone as a delivery option. They still trust human much more than technology when comes to goods delivery, especially high-value goods.
But in the future, technology devices may get universal acceptance and play a part in delivery.
In-Store Shopping Survey
34. The most common factor to shop at a particular physical shop is the price (89%), followed by location (51%), stock availability (41%), brand (40%), good warranty & return policy (28%), good loyalty program (21%), parking availability (18%), and shop environment (12%).
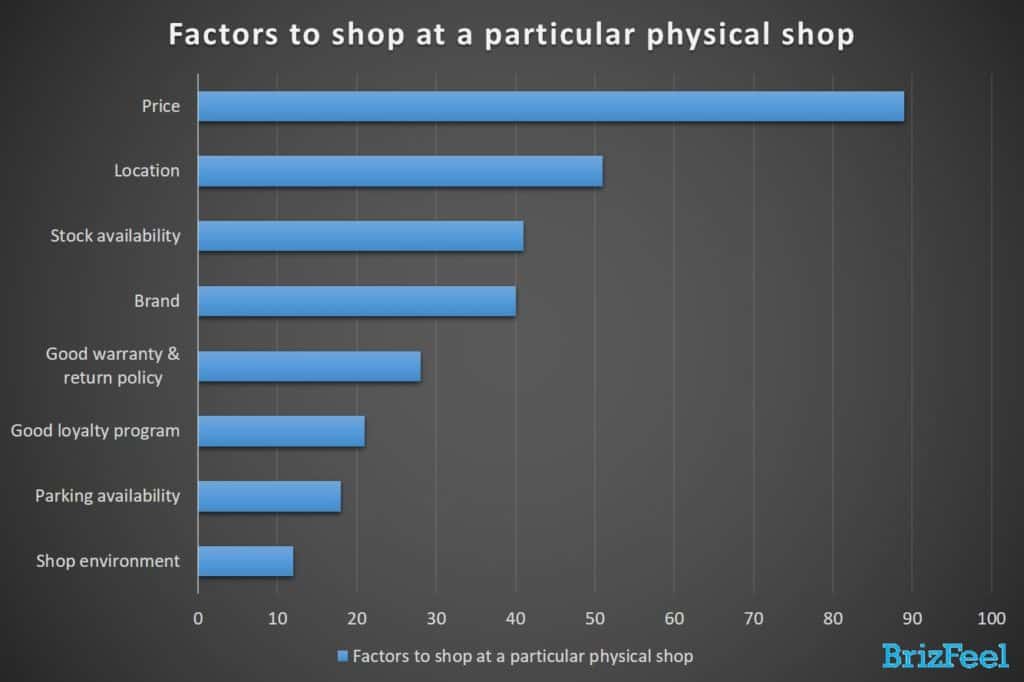
Insights: Good location, stock availability, and brand are the three important factors after the price for consumers to choose which particular store to shop.
35. 38% of consumers said they shopped at physical stores regularly.
Insights: Despite the e-commerce trends are on the rise, consumers still shop at physical stores for various reasons.
Amazon Survey (based on US & UK)
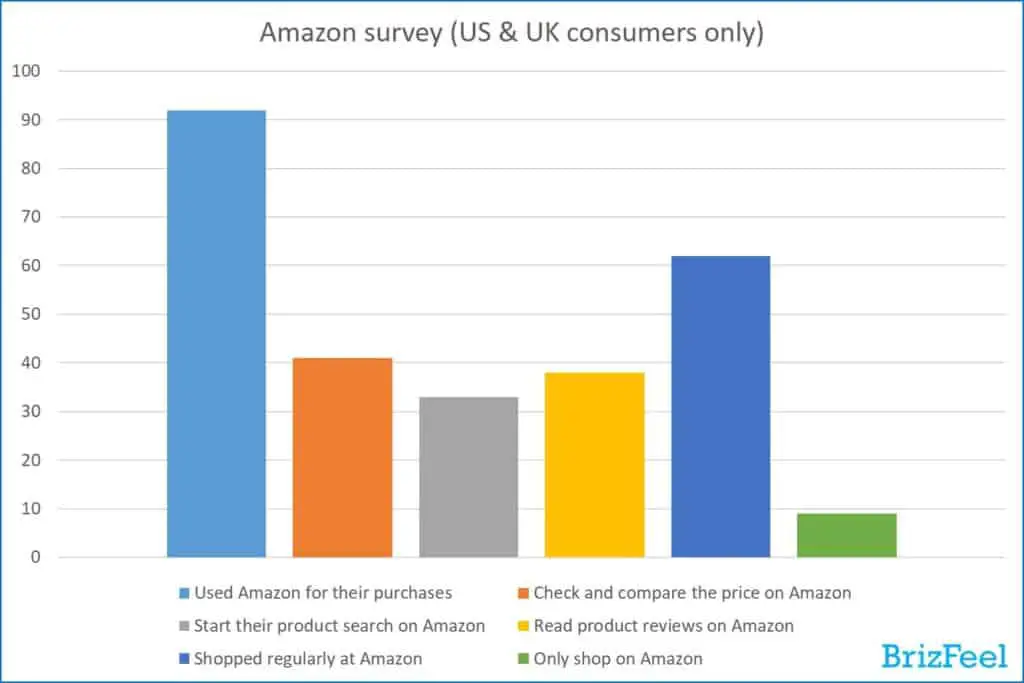
36. 92% of consumers said they used Amazon for their purchases.
37. 41% of consumers said they check and compare the price on Amazon.
38. 33% of consumers said they start their product search on Amazon.
39. 38% of consumers read product reviews on Amazon.
40. 62% of consumers said they shopped regularly at Amazon.
41. 9% of consumers said they only shop on Amazon.
Insights: Amazon was used heavily in certain countries like US and UK, while not much on some region such as Eastern Asia and Southeast Asia.
Consumers Shopping Experience Feedback
42. 34% of consumers said that buggy and complicated websites are the most frustrating aspect when it comes to shopping online, followed by too many ads & pop-ups at 29%, slow website at 28%, and lack of product information at 9%.
43. Only 27% of consumers said they will try to access a website again after they had trouble accessing it, while 73% of consumers said they will visit another website.
44. 96% of consumers said they preferred mobile offers than print offers.
45. 93% of mobile consumers said they prefer to shop online using mobile shopping apps over the mobile browser.
46. 63% of online consumers said they prefer to shop online using PCs (39% due to larger screen size and 24% due to functional limitations using mobile browser/shopping apps), while 37% of consumers prefer using mobile phones (28% due to accessibility and 9% due to loading speed).
47. 55% of female consumers said that they enjoy online shopping compared to 35% of male consumers.

48. The top factor that drives customer loyalty for online consumers is customer experience (43%), followed by price (36%), brand (19%), and others (2%).

Insight (e-commerce trends): While price is the top factor for consumers to choose which website to buy from, however, the top factor that drives customer loyalty is customer experience.
If you want more repeat sales from a group of loyal customers, gives an exceptional shopping experience to them.
E-Commerce Trends
Understand the latest e-commerce trends.
49. 30% of consumers said they will spend more on products and services in the next 12 months, while 51% of consumers said they will spend around the same, and 19% said they will spend less.
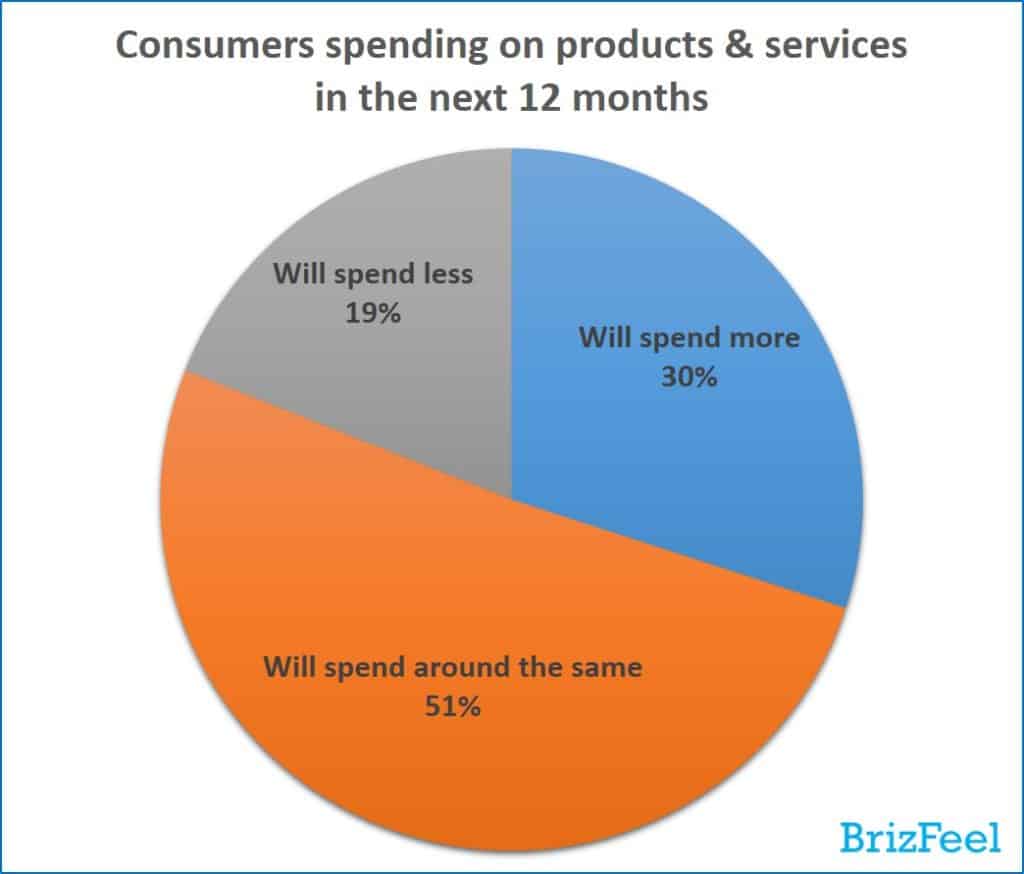
Insights: Majority of consumers are confident about their financials and market in the coming 12 months.
50. 56% of consumers spending more on buying products while 44% of consumers spending more on valuable experience.
![[e-commerce trends] Consumers spend more on products or experience](https://brizfeel.com/wp-content/uploads/2018/09/Consumers-spend-more-on-products-or-experience.png-1024x732.jpg)
Insights: Compared to the past, more consumers are willing to spend more on valuable experiences that can be shared on their social networks and memories for the future.
Why Do People Shop Online?
As per our consumers’ online shopping behavior survey, people loved to shop online.
Online shopping is beyond buying for necessity, but it’s part of the lifestyle for many people, it’s an addictive activity that can be done while waiting for traffic lights, during lunch break, killing time, and more.
The online purchase trends will not slowing down.
For myself, I only shop occasionally for fresh groceries at supermarkets, and I purchased 90% of goods via mobile shopping apps.
In my experience, products at e-commerce stores are cheaper than local stores, and I’m able to secure free shipping deals most of the time.
It’s so convenient as I can get the products delivered to my doorsteps in 1 to 3 days, I don’t even need to leave my house to get the things I want to like the old days.
From small electronic gadgets to big home appliances and furniture, I bought online.
Besides, it’s much easier to compare the price on online marketplaces, just a few clicks and searches will do the job.
Consumer Survey Report Explained
We have come out with a set of consumer survey questionnaires to carry out the consumer surveys online.
We asked a series of consumer behavior survey questions to find out the current consumers’ shopping and spending behavior on both online and retail shopping.
The consumer awareness survey report will show what consumers think about online shopping and physical shopping experience, and how they react to them.
Consumers Shopping Survey: E-Commerce Trends vs Retail Trends
1. 57% of consumers prefer to shop online, 31% of consumers prefer visiting the physical shop, while 12% of consumers said both ways are the same for them.
In this digital era, online shopping is the trend, with 57% of consumers prefer to shop online, and this figure of online purchase trends is expected to increase over 60% in the next few years after the younger generation grows up.
E-commerce is trending and taking a large piece of retail market shares.
Nevertheless, the retail trends are not going to die out anytime soon, as people treat retail shopping as part of the lifestyle activities and experiences.
In the shopping mall, you will still see groups of teenagers hanging around, do window shopping, eating, trying out clothes and jeans, and more.
Believe it or not, brick and mortar will still survive for a long time, even though the impact of online retail is significant.
Consumers Online Shopping Behavior: Large Online Retailers vs Smaller Web-Stores
2. 78% of consumers are likely to shop on large online retailers, compared to 52% on marketplaces, and 43% on smaller web-stores.
In the consumer confidence survey, people are more confident to buy on large online retailers as they believe these platforms have better security, buyer protection, and stricter policy on sellers.
In other words, large online retailers tend to gain more trust from consumers due to their brands and popularities.
Besides, large online retailers are running attractive promotions more frequently than others due to their strong financial background and a large team of people, which attracts more consumers to shop and spend on these platforms.
For instance, Cyber Monday and Black Friday sales in the United States and Singles Day (11.11) from China are some of the biggest sales events that break e-commerce spending records year after year.
Some of these large online retailers are Amazon (US), eBay (US), Walmart (US), Groupon (US), Zalando (Europe), JD.com (China), Tmall (China), Taobao (China), Aliexpress (China), Rakuten (Japan), and Shopee & Lazada (SEA, according to CozyBerries).
Consumer Online Shopping Survey Research: Why People Love to Shop Online?
3. About one-third of consumers said the top reason to shop online is the ability to shop 24/7 (32%), followed by lower price (29%), convenient (22%), and save time (17%).
Aside from the lower price, the ability to shop at any time and anywhere is another big advantage of online shopping.
You can do your online shopping in the comfort of your home wearing pajamas and laying on the bed.
You can shop for various products like electronic gadgets, clothes, hardware, groceries, flowers, pet foods, supplements, and more without leaving your home and driving around the city.
These are the convenience and experience that can never be fulfilled by physical shopping.
Consumer Trust Survey: Do Testimonials Help in Credibility?
4. 45% of consumers said they prefer to shop e-commerce websites with more testimonials.
People are interested to know what others’ experience after shopping on the e-commerce site.
And that’s the reason why you can see many of the sellers are posting customers’ testimonials on their homepage as more positive testimonials will boost trust in purchasing on the site.
Consumers Online Shopping Experience: The Disadvantages of Online Shopping
5. Over half of the consumers said the biggest drawback of online shopping is not able to touch, feel, and try a product (51%), followed by lack of physical shopping experience (24%), the possibility of damage for a fragile item (11%), lack of interactivity (5%), scam & fraud issue (5%), and delay in delivery (4%).
Based on the consumer survey results, online shopping is not perfect.
The main disadvantages of e-commerce and online shopping are not able to touch, feel, and try a product and lack of physical shopping experience.
That’s something that can never be achieved by online shopping, and that’s one of the reasons why physical stores can survive because they can provide instant fulfillment to the consumers.
Customers visiting a physical shop can instantly see, touch, and feel a product, and if they can buy and own it instantly if they want it.
When you need something urgently, you would rather pay a trip to the local store to buy it instead of buying online.
Consumer Habits Survey: How Much Time You Spend on Shopping Online?
6. Consumers spend an average of 5 hours a week shopping online.
7. 92% of consumers said they shop online at least once a year, 67% of consumers shop online at least once every month, 25% of consumers said they shop online at least once a week, and 4% of them said they shop online daily.
The average time increases with the raising of more online shopping platforms like e-commerce sites, social media stores, supermarket apps, online groceries, and individual web-stores.
The enhanced features of smart cross-promotion, product carousels, and recommended deals further increase the average time a user spends on shopping.
Undeniably, online shopping has become their habit the moment they launch a shopping app without a product to buy in mind, but simply want to shop and see if there is anything or good deals they can buy.
Consumers Online Shopping Behavior: Top Platform Used for Online Shopping
8. The mobile phones are the top platform used for online shopping at 49%, followed by PCs at 43%, and tablets at 8%.
11. 27% of consumers said they used their smartphone to make monthly purchases, while 24% of consumers used their pc for monthly purchases.
With the improved technology and price drop of smartphones, it’s not surprising that the smartphone users exceeded desktop and pc for shopping activity, mobile phones will still be the top platform used for online shopping in the future.
Besides, smartphones are more easily accessible compared to pc/laptop, which makes it a more frequently used device for online shopping.
Moreover, with the introduction of more user-friendly and fast performance shopping apps, mobile shopping activities across the globe are further skyrocketed.
Consumer Online Shopping Behavior Survey: Before Making a Purchase
9. 62% of consumers will read the shipping & return policy before making a purchase.
While the shipping & return policy is meant to read by all buyers, however, 38% of them do not read it.
10. 39% of consumers will look for recommendations from friends and family before purchase.
Besides, purchases are not a personal thing for 39% of consumers, especially for couples who need to discuss among themselves before purchases and persons who need recommendations from friends or family to support their purchase decision.
13. 54% of online consumers will perform a product search on search engines first, while the other 46% choose to go directly to the website they want.
As Internet users are relying on search engines to direct them to the right place, a majority of consumers will perform a product search on search engines first to decide where to make the purchase.
On the other side, 46% of users go straight to a website to make the purchase, it could be an individual web-store or large online retailers like Amazon.
Consumer Online Shopping Behavior Survey: After Making a Purchase
12. Only 22% of consumers are likely to share a product or service on their social networks after purchase.
15. 27% of consumers have posted a review or feedback online.
Social share, review, and feedback for products are important for the merchants and other consumers, however, less than one-third of consumers will share a product or service on their social networks or leave reviews or feedback after the purchase.
Consumer Behavior Survey: Offer Redemption
14. 71% of consumers have redeemed a mobile offer and only 8% of consumers have redeemed a print offer.
44. 96% of consumers said they preferred mobile offers than print offers.
As the shopping dynamic is moving online, the print offers are getting lesser, and more merchants are going digitize and paperless with their offers.
Also, it’s easier and convenient to redeem a mobile offer compared to a physical print offer.
Consumers Online Shopping Behavior Survey: Privacy and Data Sharing
16. 52% of consumers willing to share data in exchange for benefits such as reward, quicker service, and personalized offer.
About half of the consumers are willing to share their data in exchange for their benefits.
Based on the result, it’s understandable why most online retailers and marketplaces offer attractive signup benefits like discount coupons and irresistible rewards for new users, it’s a surefire way to increase the user base.
This a consumer psychology strategy, when there are no benefits, people are unlikely to share out their data, but it’s a different case in front of lucrative offers and rewards.
In digital marketing, this is called the “lead magnet” strategy, in which you offer something in exchange for a user’s data like an email address to get leads for your business.
Discount Coupon Survey: Male vs Female
17. 51% of female consumers said that they will search for discount coupon codes for online purchases compared to 27% of male consumers.
Female shoppers are likely to search for discount coupons for their purchase saving compared to male shoppers.
Consumers Survey Data: Brands and Social Media Influences
18. 38% of consumers said they followed a company brand on social media.
A brand’s appearance on social platforms is crucial for brand success as most consumers have social media accounts and 38% of them followed a company brand on social media.
Besides, the interaction of a brand and consumers on the social media platform is one of the effective ways in boosting consumer loyalties.
19. 46% of consumers said they find their inspiration for purchase using social media, followed by 41% using e-commerce platforms, 27% using blogs, 26% using individual retail websites, 19% using deals & coupons websites, 15% using comparison websites, 11% using newsletter email from brands, 9% using online communities & forum, and 6% using digital magazines.
Social media platforms have been changing the way consumers act, including purchase, with about 50% of the world’s population are on social media platforms and close to one-third of them use social media regularly.
Besides, e-commerce platforms, blogs, and individual retail websites are among the popular sources for consumers to find their inspiration for purchase.
Consumer Awareness Survey Report: Source of Initial Product Awareness
20. Retail websites are the most common sources of initial product awareness at 23%, followed by physical shops at 19%, online advertisements at 16%, offline advertisements at 15%, social media at 11%, online reviews at 8%, and communication with friends at 8%.
Most consumers gain initial product awareness through retail websites, which is more than advertisements and social media.
As per the shopping survey result, retail websites are one of the main contributors to product awareness in the consumer market.
Consumers Spending Statistics: Online Purchase Penetration Rate
21. 87% of consumers have made an online purchase.
The online purchase penetration rate is high at 87%.
With e-commerce and online shopping becoming a norm for most consumers, the online purchase penetration rate is expected to further increase in the coming years.
We can also see that more older consumers are gaining trust in making a payment via online channels and their purchases with online retailers.
It’s a good sign for e-commerce trends.
Internet things are not limited to younger generations, but older generations are picking up too.
Online Shopping Statistics: Video Influence on Consumers Online Shopping Behavior
22. 68% of consumers are more likely to purchase if they can watch a video explaining the product or service beforehand.
In the past decade, most products on e-commerce and large online retailers platforms are only texts and images.
But in recent years, you can see that more products on these platforms contain at least a video to describe and showcase the products.
Consumer’s demand has increased, they want to see dynamic videos instead of static images to better understand the products they are interested in buying.
Online Shopping Statistics: Reviews Impact on Consumers Online Shopping Behavior
23. 94% of consumers will not buy from an online store with the majority of bad reviews, 27% of consumers said they will be affected by a minority of bad reviews, and 35% of consumers will not buy from an online store with no reviews at all.
Reviews are something most consumers always see to decide whether a product or service is good or bad.
I can recall that many times I feel like buying a product and get hold back eventually by a few negative reviews (if they make sense), and I’m sure that I will buy it if those negative reviews never exist.
I believe many consumers feel the same way as me, and the consumers’ shopping survey proved my point.
But here are two things to keep in mind in filtering the reviews intelligently.
- Good or positive reviews can be purchased and manipulated
- Bad or negative reviews can be written by competitors
A simple quick google search landed me on a site that sells both positive and negative reviews on various platforms like Amazon, Google, Facebook, Trustpilot, Tripadvisor, Yelp, Glassdoor, BBB, Yellow Page, and more.
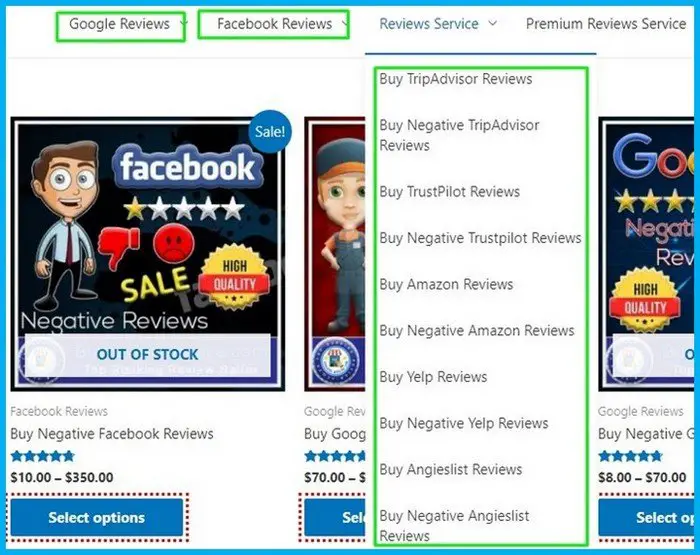
My advice: Spend some time going through the reviews and do some research outside of the platform (eg: blog, forum, Quora, etc.) before making a purchase decision.
Consumer Spending Pattern: Top Factors for Purchases
24. The top factors in making a purchase from which website is the price (89%), followed by brand (57%), delivery method and return policy (49%), shop reviews (47%), refund policy (44%), business aged (11%), and others (3%).
Price is still the main deciding factor for consumers’ purchase.
For online shopping, it’s easier for shoppers to compare the price among various platforms, and most of them will buy from the platform that has the cheapest offer.
Brand loyalties are still one of the most important elements to increase sales and sustain business revenue.
Delivery is part of the online purchase process. The method of delivering the products to the consumers as well as the return policy plays a large part for consumers in deciding where they would make the purchase.
Online Shopping Survey: Online Groceries Penetration Rate
25. 46% of consumers made a purchase online for groceries.
In the past, even when e-commerce and online shopping are trending, grocery shopping is still mainly physical shopping activity for most consumers, especially for fresh ingredients.
But in these few years, consumers are changing spending habits on groceries shopping.
With the pandemic attack like Coronavirus disease COVID-19, where most consumers are forced to make groceries shopping online, has further increased the penetration rate for online groceries purchase.
We can see from the news reports that most online grocery shopping and delivery platforms are constantly overloaded in this period.
For some consumers that experienced the convenience of online groceries shopping during the virus pandemic and restriction, they are likely to continue to purchase groceries online after the restriction is lifted or pandemic is over.
Online Shopping Statistics: Membership Benefits
26. Consumers valued unlimited free delivery from paid membership more than others (79%), followed by exclusive discount (63%), access to paid member only deals (57%), earning rewards from purchases (41%), priority support (38%), and lucky draw & events (22%).
As delivery is part of the online purchase process, it’s not surprising that consumers who are willing to sign up for paid membership are expecting unlimited free delivery as one of the main benefits.
Besides, exclusivity is another main benefit that a paid member expects, like the paid-member-only exclusive discount and deals.
Earning rewards or points from purchases is one of the strategies that widely used by various e-commerce stores and online retailers to encourage users to sign up for memberships and boost loyalties.
Consumer Trust Survey: Security Concerns of Online Shopping
27. 72% of consumers only purchase from credible websites to reduce the risk of online scam & fraud, 57% said they only purchase using the payment gateway they trust, 49% said they will avoid clicking on ads, 35% choose to use different passwords for different websites, 27% said they only use a credit card with purchase protection, and 21% choose to purchase from their own country only to minimize the risk.
For activities involving money and personal data like online purchases, trust and security are highly important for consumers.
So to attract buyers to purchase on your online shopping platform, boosting your site’s and brand’s credibility and trustworthiness should be the main objective other than traffic.
E-Commerce Survey: Cart Abandonment Statistics
28. 78% of consumers had abandoned their cart at least once.
29. The top reason for cart abandonment is the high additional cost upon checking out at 67%, followed by a change of mind at 23%, payment issue at 6%, and other reasons at 4%.
It’s common for shoppers to add a lot of items into the cart but end up not checking out.
The main reason why shoppers abandon their cart is due to additional costs like changes in shipping fees and extra handling fees imposed.
Some shoppers said that they add a few similar items into the cart for later comparison and consideration.
Goods Delivery Survey: What Consumers Think About Delivery
30. 91% of consumers are expecting to receive their goods within 3 business days.
31. 37% of consumers said they are willing to pay extra for same-day delivery.
32. For the extra delivery benefits (offered at no additional cost), 67% of consumers preferred same-day delivery, followed by free return shipping at 65%, parcel tracking at 59%, delivery at specific time slot at 57%, shipments insurance at 43%, and pick-up at nearby partner stores at 9%.
With the improvement of logistics services, particularly on the speed, a majority of consumers now expect to receive their items within 3 business days, and this is the delivery standard to entice customers nowadays.
By doing a quick search on some of the popular e-commerce platforms, I found out that a portion of bad reviews (1-2 stars) are due to slow delivery, which is in line with e-commerce shopping survey results.
More than one-third of consumers are willing to pay extra to get their items on the same day showed that buyers value the speed of delivery.
Same day delivery is also the top extra benefit sought by consumers.
Delivery Method Survey: Drone Delivery
33. Only 14% of consumers trust drone devices as a delivery method for any product, while 17% said they can consider them for low-value products.
Consumers still preferred real person delivery compared to drone devices.
But for low-value products, a minority of them said they can consider trying them out.
Retail Shopping Statistics: Factors of Which Shop to Visit
34. The most common factor to shop at a particular physical shop is the price (89%), followed by location (51%), stock availability (41%), brand (40%), good warranty & return policy (28%), good loyalty program (21%), parking availability (18%), and shop environment (12%).
Regardless of offline or online shopping, price is the leading factor for shopping and purchase.
The reason is the majority of people are from low to medium income groups, so the financial capabilities make price the most important factor when coming to spend.
Unlike online shopping which is equipped with a large delivery coverage, physical shopping requires consumers to drive from their home to the store location to shop, which makes shop location the next deciding factor as most people prefer to shop at nearby stores.
Retail Shopping Statistics: Shopping at Physical Stores
35. 38% of consumers said they shopped at physical stores regularly.
While retail trends are impacted by online shopping, more than one-third of consumers still shop regularly at physical stores, partly due to the lifestyle and habits elements, and partly due to the advantages of physical stores such as instant fulfillment and urgent needs.
Amazon Survey Report (US & UK): How Consumers Use Amazon
36. 92% of consumers said they used Amazon for their purchases.
37. 41% of consumers said they check and compare the price on Amazon.
38. 33% of consumers said they start their product search on Amazon.
39. 38% of consumers read product reviews on Amazon.
40. 62% of consumers said they shopped regularly at Amazon.
41. 9% of consumers said they only shop on Amazon.
With 92% of consumers shopped at Amazon and 62% of them are regular shoppers, Amazon is clearly the most popular online shopping platform in the US and UK.
Besides, about one-third of consumers used Amazon for shopping activities like price comparison, product searches, and read product reviews.
Interestingly, 9% of consumers said that Amazon is all they need when it comes to online shopping, which further establishes their dominant state in the US and UK online market.
Consumers Online Shopping Experience: What Make Consumers Frustrate
42. 34% of consumers said that buggy and complicated websites are the most frustrating aspect when it comes to shopping online, followed by too many ads & pop-ups at 29%, slow website at 28%, and lack of product information at 9%.
43. Only 27% of consumers said they will try to access a website again after they had trouble accessing it, while 73% of consumers said they will visit another website.
The smooth experience in using the platform is vital for consumers to enjoy the shopping process.
Buggy and complicated websites will make consumers become frustrated and cause them to leave the platform because they couldn’t do what they want fluently.
Besides, too many ads and slow loading speed will also stop consumers from shopping on the platform because people hate ads and are impatient to wait for a product to fully load.
Constantly monitoring a website’s health and status is what online retailers need to pay attention to, as only a minority of users will try to access the website again (after they had trouble accessing it) and a majority of them will visit competitor websites instead.
Consumers Preferences Survey: Mobile Browser vs Mobile Apps
45. 93% of mobile consumers said they prefer to shop online using mobile shopping apps over the mobile browser.
Even though most of the websites are mobile responsive, however, the usability and experience are still far behind users’ expectations.
On the other side, mobile shopping apps are developed with the goal to provide the best user experience and shopping functionalities, which gives users a smooth control and navigation in the apps.
So it’s not surprising that 93% of mobile consumers prefer to shop using mobile shopping apps.
Consumers Preferences Survey: PCs vs Mobile
46. 63% of online consumers said they prefer to shop online using PCs (39% due to larger screen size and 24% due to functional limitations using mobile browser/shopping apps), while 37% of consumers prefer using mobile phones (28% due to accessibility and 9% due to loading speed).
While a majority of consumers said they prefer to use a PC or laptop for online shopping, however, the limited accessibility still makes a large portion of them end up shopping using mobile apps.
While 37% of the users prefer to shop using mobile apps due to advantages like accessibility and faster speed.
The figure is expected to increase further with the enhancing of mobile shopping apps.
Consumers Online Shopping Survey: Male vs Female
47. 55% of female consumers said that they enjoy online shopping compared to 35% of male consumers.
Female consumers tend to enjoy online shopping more than male consumers.
Some of the consumers felt that online shopping is a time-wasting activity for them due to a large number of products to research and filter.
Some male consumers said they rather spend their time doing something else, like sports, gaming, and working.
Consumers Survey: What Drive Customer Loyalty
48. The top factor that drives customer loyalty for online consumers is customer experience (43%), followed by price (36%), brand (19%), and others (2%).
The price is not the most important factor in driving customer loyalties.
While the price is still an important factor, consumers nowadays value customer experience over price.
A consumer will not buy from a particular online shop if they received bad customer experience, even though the price is cheap.
Consumer Confidence Survey: E-Commerce Trends
49. 30% of consumers said they will spend more on products and services in the next 12 months, while 51% of consumers said they will spend around the same, and 19% said they will spend less.
In the consumer confidence survey, we found out that a majority of consumers are still confident with their spending powers and some of them will continue to spend more in the coming months.
Nevertheless, some consumers are spending less due to the economy and their financial capabilities.
In the current Coronavirus pandemic, consumer spending falls for some categories, but on the flip side, they spend more on other categories like healthcare products and groceries.
Based on the consumer spending pattern, we knew that consumers are changing spending habits.
Consumers Spending Behavior: Product vs Experience
50. 56% of consumers spending more on buying products while 44% of consumers spending more on valuable experience.
While products are still taking the larger part of consumer spending, more consumers are starting to spend more on getting valuable experience from various activities like travels, outdoor activities, unique dining experiences, massaging, workshops, and more unique experiences.
Compared to the past where most people are spending money on products, now consumers are spending a large portion of their money on valuable experiences, as people nowadays are looking for a better lifestyle other than basic needs.
Conclusion
Based on our survey on consumers’ online shopping behavior, online shopping using mobile apps is what preferred by consumers nowadays. It’s one of the e-commerce trends and the future for retail shopping.
While online shopping and e-commerce is the current retail trend, however, based on our online shopping vs store shopping statistics, brick-and-mortar shop doesn’t seem to die out anytime soon. It seems like consumers are seeking something else from physical shopping.
From our understanding, consumers are shifting their views about in-store shopping from necessary to something sensory like social experience and lifestyle.
That’s one of the reasons why shopping malls are still crowded during weekends and public holidays, and many physical stores still have their desired weekly visits.
It’s just that physical shops need to understand and catch up what consumers are looking for in order to sustain and grow their businesses.
For in-store retailers, we believe the best way is to become an omnichannel retailer as consumers shop across both online and offline channels.
For online retailers, understand the consumers shopping behaviors and approach them strategically is the way to stand out from the crowd, especially in this competitive online retail world.
So, make use of the e-commerce statistics data to increase your competitive advantage on the online purchase trends.
Related Research Posts:
- 443 Digital Marketing Facts
- 160 Astonish Internet Facts
- 15 Survey Statistics to Improve Survey Response Rate
- Luxury Goods Market Statistics
- Christmas Statistics & Facts
- Fun Facts About Each of the US States
- Temu Statistics & Facts
As an online marketer, it is a must-have article to read. thanks
We wanted to know more about the effects of the online shopping trend, internet, online purchase trends, and technologies towards the retail world, such as consumers preferences on retail shopping, what are their opinions on the shopping experience, and the future trends in consumers spending.
Good Job I like this very much.
Simply want to say your article is fantastic and informative. The clearness in your post is simply great. Bandle of thanks and please keep up the rewarding work.
Admiring the time and energy you put into your site and the in-depth information you provide.
It’s awesome to come across your blog. I’ve bookmarked your site and I’m including your RSS feeds to my Google account. Most persons love shopping online but couldn’t do that because they don’t have a credit card. Sometimes there are unable to transfer due to network failure. Shopping online with credit does help to save time and the stress of going to the shop. But with a credit card, you can make use of online shopping as much as you want to.
Thank you so much. It is very what i am looking for
Thanks you for the knowledgeable post which has helped a lot peoples. Keep it up for providing valuable information..
Most persons love shopping online but couldn't do that because they don't have a credit card. Sometimes there are unable to transfer due to network failure. Shopping online with credit does help to save time and the stress of going to the shop. But with a credit card you can make use of online shopping as much as you want to.
Well Written and Explained Article. Keep the good work on. Thanks
Nice, piece of information. Thanks for sharing this valuable information.
Excellent informative post.
Why people still make use of to read news papers when in this technological globe everything is accessible on web?
While the news can be accessible from web, not all the people know how to or willing to access them via digital channels.
Some of them still have no or limited access to internet.
Some of them don’t like to stare on a screen for long, especially the elderly.
Some of them still used to read physical news paper even though they know the news can be read online, it’s about preference and habit.
I’d like to find out more? I’d want to find out some additional information.
Sure.
It’s impressive for this post.
Thank you!
Thus is a really good findings. Bookmarked!
Thank you for the post.
That’s quite accurate, especially for American like me.
Thanks.
Nice topic and worth reading Thank you for your effort!
Thanks Salim.
Fantastic piece of content, keep it up!
I’m looking for this kind of information, thank you so much.
Thanks Albert!
Admiring the time and energy you put into your site and in depth information you provide.
It’s awesome to come across your blog. I’ve bookmarked your site and I’m including your RSS feeds to my Google account.
Thanks Mindy.
Simply want to say your article is as astonishing. The clearness in your post is simply great. Well with your permission let me to grab your feed
to keep up to date with forthcoming post. Thanks a million and please keep up the rewarding work.
Thank you.
Very great post. I just stumbled upon your blog and wanted to say that I have truly loved surfing around your blog posts.
In any case I will be subscribing for your rss feed and I hope you write once more very soon!
Thanks.
Thanks admin for sharing this informative post.
You are the most welcome!
Great data!
Thanks.
Great info!
Thanks.